Hi guys, Does anyone know whether or how the waterfall chart can actually be configured so that I can use variances directly instead of providing totals and let the waterfall chart calculate it? This would be far more useful.
Typical use case: First column is Budget “All Locations”, last column is Actual “All Locations”. The waterfall should then represent the Actual/Budget variance for each location. Apparently I could only achieve this with the current waterfall directive by calculating something like “Budget All Locations + Variance Location x”, which would be kind of stupid because I already have the value that should be used in the waterfall in the first place. Hope that makes sense…
That is how we have currently implemented it to make it as simple as possible. In your case it may be easier to build the chart directly using JavaScript.
I have just encountered the same issue as @aalex and I think it would be great if you could revisit the current implementation of Waterfall charts as it is fundamentally different from the way they are normally implemented and used.
Waterfall/Bridge charts can be extremely useful for variance/breakdown analysis, especially for TM1 financial data, but not so much for trend analysis - which is what it is essentially currently doing. I agree with @aalex that the standard implementation would be much more useful.
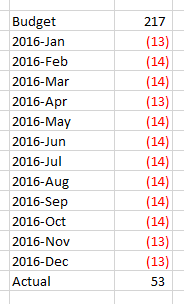
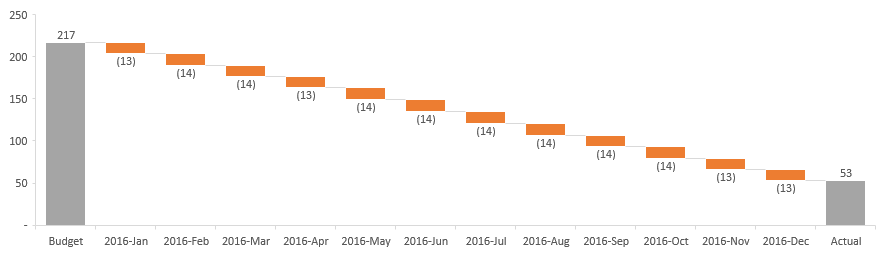
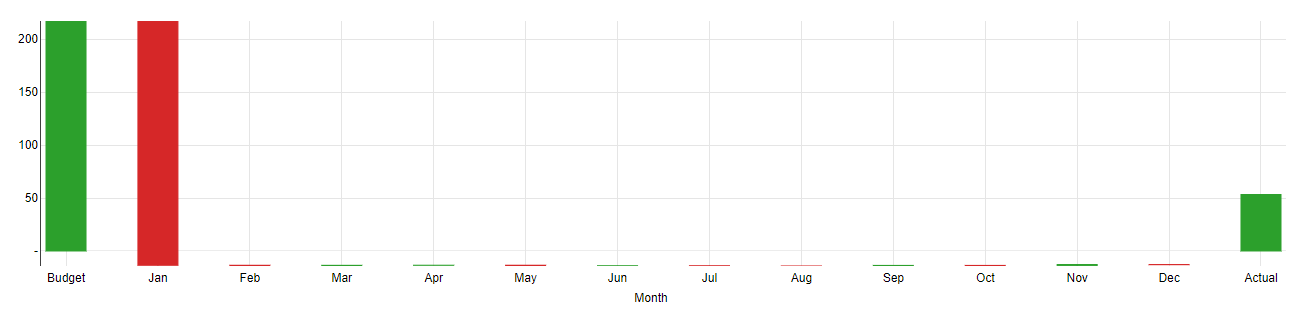
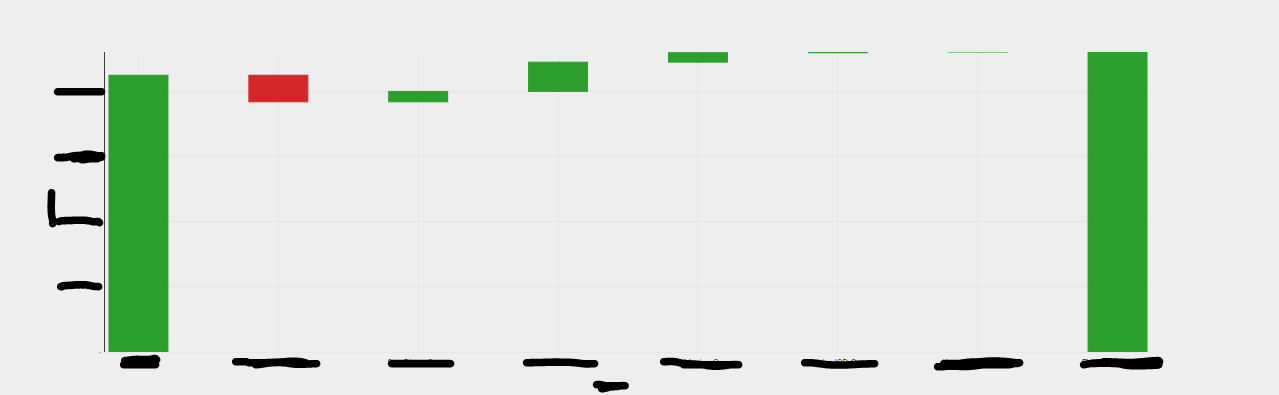
Please see an example below of Excel 2016, which is using a typical waterfall chart implementation, compared to Canvas on the same simple data set.
We have a different version of the waterfall chart on the roadmap (not top priority at the moment though). In C3 we have already implemented another type of waterfall chart but it is not very generic yet - you can get in touch with me in case you want to have the code to maybe cover your specific use case.
This feature might come in future releases but we do not have an ETA yet.
Alternatively, you can use external 3rd party JS libraries or one of the other charting libraries within Canvas - DimpleJS - and this is its implementation of Waterfall DimpleJS - Waterfall.
Hi @plim, I’ve had a look at the dimple waterfall it looks like it will meet our needs. I’ve used cellsetGet to get the required values then pushed them into an array in the required format.
The array is fine as I can can paste in the output in and the chart renders as expected, but can you point me in the right direction so as to get the chart to wait for the data to be ready and also to respond to changes in users selections.
There seems to be some compatibility issues between DimpleJS and d3. But going back to this, since you are using cellsetGet() function and the JS overall, it may look simpler with the current tm1-ui-chart directive and using the tm1-ui-chart-value directive instead.
Attached is an example of how you can utilize tm1-ui-chart directive with cellsetGet() and with a simple selective which changes the chart values on user selection.
Then if you have variances in your TM1 model instead of the actual value, you can alternatively work out the running total to feed into the chart via JS, if you do not have it in the model.
No need to import http://d3js.org/d3.v3.min.js libarary already part of canvas.
You can ng-if the chart container and re-init the chart once filter changes
Thanks
Ilia
Hi,
I am using canvas 3.2.0, and would like to try to work around the chart waterfall
but my /#/help page of directive tm1-ui-chart is still showing v2.0 chart type:
tm1-chart-type="{line|lineWithFocus|discreteBar|multiBar|multiBarHorizontal|pie}"
please advise is it simply input tm1-char-type=“waterfall”? Thank you.
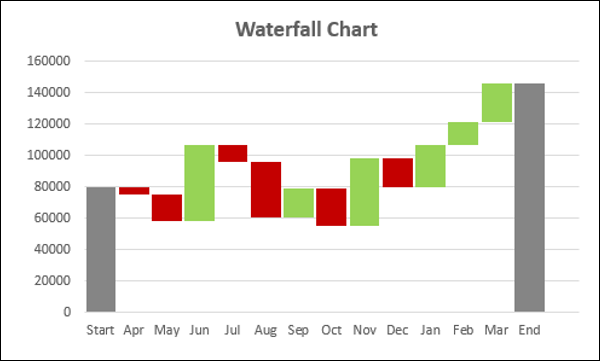
I have got the same problem as @prajtar, that the waterfall on canvas does not calculate intermediate cumulative up from left to right. like below picture
but turn out it shows like prajtar’s picture in his previous reply.
Thank you very much.
That is how it was implemented to make it as simple as possible. The update for this may come in future releases but we do not have an ETA yet.
Alternatively, there were a number of ways mentioned on this topic post on how you can possibly go about it which we will suggest for you to have a try on.
thanks very much @Ger4754, I’m still struggling on how to make the dataPoints yValue from hardcoded to variables…
Apparently the ng-model (that works well for tm1 directive that not applicable to those DimpleJS code)
we used the native chart and passed the values from js to tm1-ui-chart-value as per the attachment on @plim previous comment all we had to do was add a variable to retain the previous value in the dbr requests to calc the offset to position the bar correctly