Hi @tryan,
I have just encountered the same issue as @aalex and I think it would be great if you could revisit the current implementation of Waterfall charts as it is fundamentally different from the way they are normally implemented and used.
Waterfall/Bridge charts can be extremely useful for variance/breakdown analysis, especially for TM1 financial data, but not so much for trend analysis - which is what it is essentially currently doing. I agree with @aalex that the standard implementation would be much more useful.
Please see an example below of Excel 2016, which is using a typical waterfall chart implementation, compared to Canvas on the same simple data set.
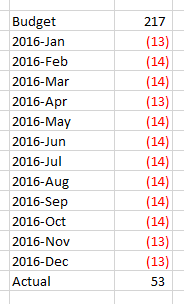
Data set:
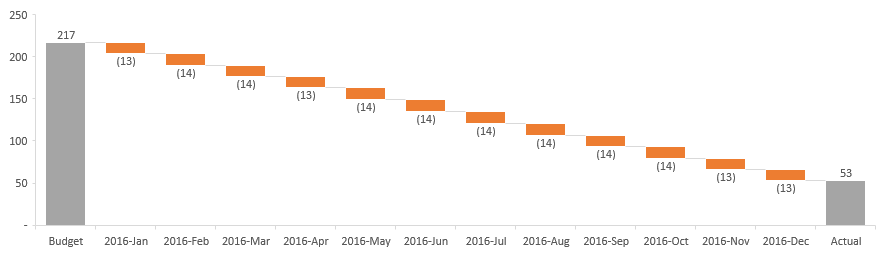
Excel 2016:
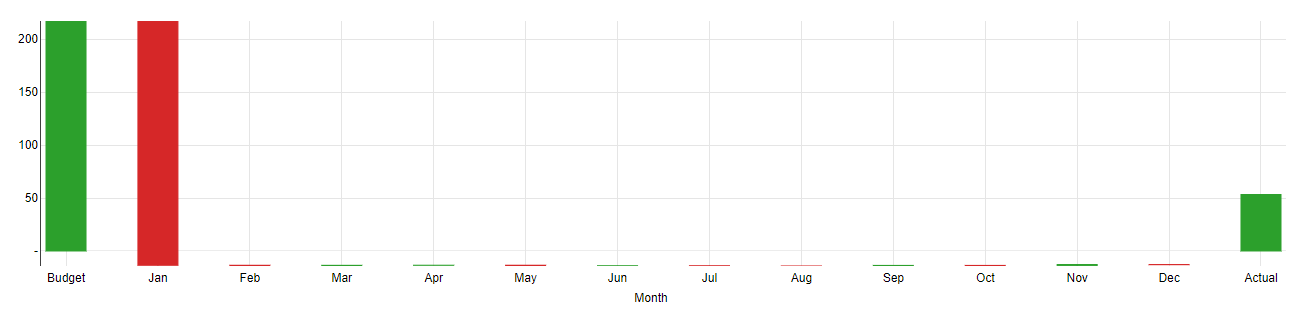
Canvas: