Hello experts,
I’ve created a Waterfall chart in UX and would like to change the colour of the first and last data points, can this be done?
Thanks,
David
Hello experts,
I’ve created a Waterfall chart in UX and would like to change the colour of the first and last data points, can this be done?
Thanks,
David
Hi,
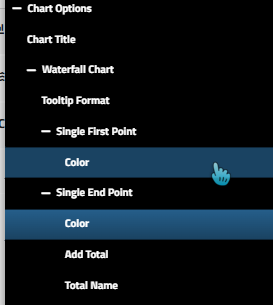
Sure, you can change it using the below options.
Hi @Ulas,
Unfortunately, that has not worked for me. I think it’s because I’m using the widget type Waterfall, not Waterfall-single. It seems those colour options only work for Waterfall-single?
Thanks,
David
These options should also work with the Waterfall Single chart type. What version are you using?
Hi David,
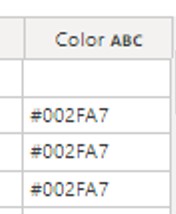
You could try to add a new string attribute named as “Color” and input the color you want. Like the screen shot below.
Hope it works for you!
    "waterfall": {
      "singleFirstPoint": {
        "color": "#c5003e"
      },
      "singleEndPoint": {
        "color": "black"
      }
    }
I am also building a Waterfall chart and tried above settings but it’s not working, seems this syntax only supports Waterfall-single chart. Is there any setting syntax that can change first and last bar color for Waterfall chart? Thanks!
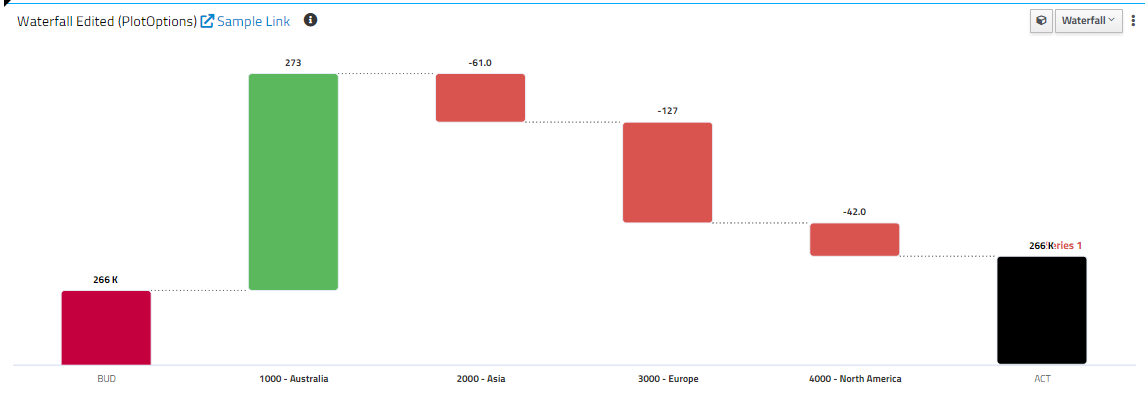
The setting should work for both waterfall widgets but it was added for the waterfall widget in FP2 or 3 (I think). I also tested in FP1 and it didn’t work but in the recent version it does.
Here is the proof 
    "waterfall": {
      "singleFirstPoint": {
        "color": "#c5003e"
      },
      "singleEndPoint": {
        "color": "black"
      },
      "yAxisMinAuto": 0.2
    },
Looks like we need to upgrade our UX version! We’re not on the latest fix pack. Thanks for the tips!