Has anyone had any luck getting the Debugger for Chrome working against a Canvas site? I can’t seem to figure out the right settings so it will see the js files.
Thanks,
Chet
Has anyone had any luck getting the Debugger for Chrome working against a Canvas site? I can’t seem to figure out the right settings so it will see the js files.
Thanks,
Chet
Hi Chet,
We normally use the Chrome developers tools directly, press F12 when in Chrome and then click on the Sources tab. Double-click on client-assets/client.js to open and add the breakpoints where you want to debug.
Yea, We have been doing it that way also. This seemed like a nice option since it works right through VS Code and half your web page isn’t taken up by a debug window. It also seems to be very popular with the people who use VS Code. Was hoping someone else here had success with it and if they did, could share the launch.json settings they used. 
Hi @chet_watkins,
You can actually put the Chrome Developer tools on another Window so it does not take any of the space for the web page. Below is where you can find that option (see the Dock side options):
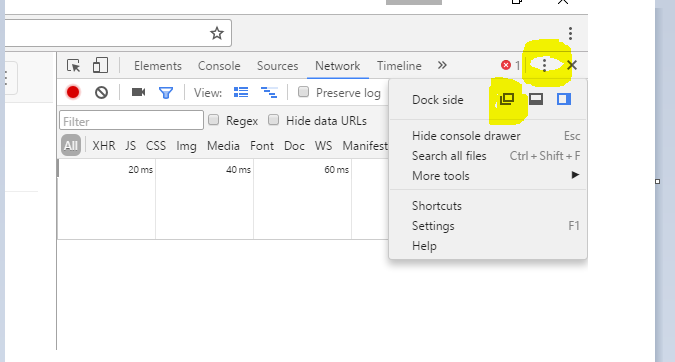
Cheers!
Paul
Hi all,
More information about how to debug a Canvas page can be found in the following article:
Cheers,
Vincent
Thanks Paul. It’s funny, I missed this every time I used it and realized you could do this when another developer I work with had it separated today.
Although, Even he thinks it would be nice to just have the debug in VS Code also, so if anyone does get it to work, please let us know.
Thanks,
Chet
Hi @plim, I was looking more into this and I believe the issue revolves around the fact that the all the js files merge into the one client.js under client-assets and have no source mapping associated to it.
My team and I would like to get this working. Any thoughts on what we would need to do? It offers sourceMapOverrides, but we are not sure what we need to use to make the client.js relate to our page named js’s. Thanks!
Here is the url to the extension
Hi @chet_watkins,
If you want to make your custom source script available, you can relocate your JS files outside of js/controllers folder, i.e. under js/custom.
The only thing is, you would then have to set it up the usual way. That is, after creating your JS files, you will need to add them as a source on your index file. Also note, that you will have to do this for each custom JS file that you will add manually and outside of js/controllers.
You should now be able to setup the add in, and be able to step through your custom scripts in VSC.
–
Paul
That doesn’t sound like a fun way to handle it. 
Do you use a 3rd party tool to combine the files like you are? If so, what is it called? I might be able to contact the maker of the debugger to see if they can add support for it.
Hi @chet_watkins,
There should be a number of ways around it.
For example, you can also just create a simple script or batch file to concatenate your custom files. That way, you only need to add one file - and keep on refreshing that file with your script/batch file.
–
Paul
