Tm1-ui-chart Useful Options Override

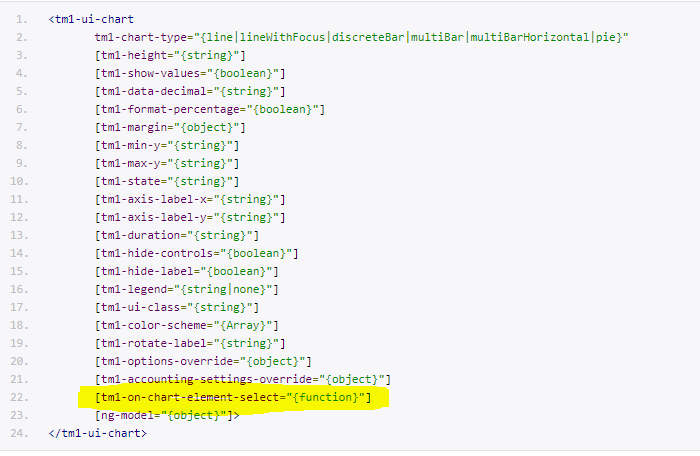
Through the tm1-options-override, various chart behaviours are now exposed and can be overwriten. How this attribute works is that it overrides the default option in the tm1-ui-chart. So you can override what you needed only!

Here are some of those that was used:

  1. Initialize Multi Bar in Stacked Mode
    attribute: tm1-options-override=“{chart:{stacked:true}}

  2. Show all labels on the x-axis (tested with multiBar so far)
    attribute: tm1-options-override=“{chart:{reduceXTicks:false}}

  3. Show Pie Chart values instead of the Labels (default is ‘key’. Other values are ‘value’ and ‘percent’.)
    attribute: tm1-options-override=“{chart:{labelType:‘value’}}

NOTE: options is just a Javascript Object. This also means that it is compose of various properties and values of which can be objects. strings, booleans, arrays, etc.

So for the above to be combined into one, you just need to write them as:
tm1-options-override=“{chart:{stacked:true, reduceXTicks:false}}”

Here is the link where you can find more information regarding the ‘options’:

https://krispo.github.io/angular-nvd3/#/quickstart

Share here all the other options that you have found so far!

1 Like

You can see an example on how to use tm1-options-override in the following link:

An option that hides the x and y-axis labels (tested with discreteBar and line charts at least):

Hi Paul;
This is good information however, How do you only hide the label/text “X-Axis or Y-Axis” without removing the entire actual axis?

Also I have an issue with the legend series in which the text is not being displayed entirely. How can we change this?

Here is the code:

    <div class="col-sm-12 chart-frame">
      <tm1-ui-chart tm1-chart-type="line" tm1-height="210" tm1-margin="chart.margin" tm1-data-decimal="0" tm1-state="{{page.titles.version}}" >                  
        <tm1-ui-chart-dbr
          ng-repeat="workingDayNumber in ['CWD 01','CWD 02','CWD 03','CWD 04','CWD 05','CWD 06','CWD 07','CWD 08','CWD 09','CWD 10','CWD 11','CWD 12','CWD 13','CWD 14','CWD 15','CWD 16','CWD 17','CWD 18','CWD 19','CWD 20','CWD 21','CWD 22']"
          tm1-instance="dev" 
          tm1-cube="Daily Sales"  
          tm1-label={{workingDayNumber}} 
          tm1-series="MTD vs {{page.titles.version}}" 
          tm1-elements='{{page.firstDayPTD.date}},{{workingDayNumber}},{{page.titles.country}},"All Products","All Customers","All Currencies",{{page.titles.rate}},{{page.titles.version}},"All Sales Order Line Types","All Sales Order Types","All Promotions",{{page.titles.measure}}'
        ></tm1-ui-chart-dbr>
        <tm1-ui-chart-dbr
          ng-repeat="workingDayNumber in ['CWD 01','CWD 02','CWD 03','CWD 04','CWD 05','CWD 06','CWD 07','CWD 08','CWD 09','CWD 10','CWD 11','CWD 12','CWD 13','CWD 14','CWD 15','CWD 16','CWD 17','CWD 18','CWD 19','CWD 20','CWD 21','CWD 22']"
          tm1-instance="dev" 
          tm1-cube="Daily Sales"  
          tm1-label={{workingDayNumber}} 
          tm1-series="MTD Actual"
          tm1-elements='{{page.firstDayPTD.date}},{{workingDayNumber}},{{page.titles.country}},"All Products","All Customers","All Currencies",{{page.titles.rate}},"Actual","All Sales Order Line Types","All Sales Order Types","All Promotions",{{page.titles.measure}}'
        ></tm1-ui-chart-dbr>
        <tm1-ui-chart-value tm1-area="true" tm1-series="MTD Actual" tm1-order-no="2" tm1-label="Mar" tm1-value="{{page.Value}}"></tm1-ui-chart-value>
      </tm1-ui-chart>
    </div>

Hi

You can use the following parameters of the tm1-ui-chart
tm1-axis-label-x=“”
tm1-axis-label-y=“”

1 Like

Hi @Nacho_Libre,

Hiding or updating that label should be via the tm1-axis-label-x/y attribute.

Check out the Help section of your Canvas application for other attributes that can be customized.

As for the other labels not showing, that is the default behavior by the underlying chart framework. To show the rest of the labels, check out the reduceXTicks option on this post.

Then, to find out all the other options you can override, you can go to this site,

https://krispo.github.io/angular-nvd3/

And play around with option values in there.


Paul

Hi ,

I tried replacing discretebar with multiBarHorizontal but it is not working.

can you please advise what I need to change to make the multiBarHorizontal clickable ?

Thank you.

					<div class="col-md-12" >
						<tm1-ui-chart 
                            ng-if="colorSchemeIsReadyPC"
							tm1-chart-type="multiBarHorizontal" 
							tm1-data-decimal="0" 
							tm1-axis-label-x="" 
							tm1-axis-label-y="" 
							tm1-hide-controls="true" 
							tm1-height="300" 
							tm1-margin="{top:10,bottom:25,left:100, right:0}"
							tm1-legend="none" 
							tm1-color-scheme="myColorSchemePC"
							tm1-state="{{selections.department}},{{selections.Color}}"
							tm1-options-override="optionsOverride">

							<tm1-ui-chart-dbr 
								ng-repeat="department in lists.department" 
								tm1-label="{{department.Name}}"
								tm1-instance="dev"
								tm1-cube="General Ledger Reporting" 
								tm1-elements="{{selections.version}},{{selections.year}},{{selections.month}},{{selections.region}},{{department.key}},All Suffix,{{selections.driver}},All Comp Status,TY,BASE,BASE,Total Distributed">
							</tm1-ui-chart-dbr>

						</tm1-ui-chart>
					</div>
$scope.optionsOverride = {
			chart:{

				multiBarHorizontal:{
					dispatch:{
						elementClick:function(e){
							// uncomment below line if you want to check what is being passed on
							 console.debug(e); 
							
							 var message = '<p>Cube: ' + e.data.cube + '</p>'
							 message += '<p>Elements: ' + e.data.elements + '</p>';
							 message += '<p>Value: ' + e.data.value + '</p>';
							 $ngBootbox.alert(message);

                           // $scope.setDepartment(e.data.elements.split(',')[2]);
							
							//$scope.selections.month = e.data.elements.split(',')[2];
						}
					}
				}				
			}
	};

Hi @wlee,

Which version of Canvas are you using? The 1.2.2 should have an attribute already to help you out on this:

Checkout the Help section if the above attribute is already there.

The Visualizations page also has an example on how to utilize the click action for multiBarHorizontal.

Let us know how it goes.


Paul

Thanks Paul for the info. Will try that out.

Yesterday manage to find out the answer and manage to get it work with below code.


$scope.optionsOverride = {
			chart:{
				multibar:{
					dispatch:{
						elementClick:function(e){
							// uncomment below line if you want to check what is being passed on
							 console.debug(e); 
							
							 //var message = '<p>Cube: ' + e.data.cube + '</p>'
							 //message += '<p>Elements: ' + e.data.elements + '</p>';
							 //message += '<p>Value: ' + e.data.value + '</p>';
							 //$ngBootbox.alert(message);

                            $scope.setDepartment(e.data.elements.split(',')[4]);
							
							//$scope.selections.month = e.data.elements.split(',')[2];
						}
					}
				}	                			
			}
	};

Is optionOverride a variable name or a reserve word ?

I tried the following and it doesnt work.

$scope.optionsOverrideDepartment = {
			chart:{

				multibar:{
					dispatch:{
						elementClick:function(e){
							// uncomment below line if you want to check what is being passed on
							 console.debug(e); 
							
							 //var message = '<p>Cube: ' + e.data.cube + '</p>'
							 //message += '<p>Elements: ' + e.data.elements + '</p>';
							 //message += '<p>Value: ' + e.data.value + '</p>';
							 //$ngBootbox.alert(message);

                            $scope.setDepartment(e.data.elements.split(',')[4]);
							
							//$scope.selections.month = e.data.elements.split(',')[2];
						}
					}
				}				
			}
	};

						<tm1-ui-chart 
                            ng-if="colorSchemeIsReadyPC"
							tm1-chart-type="multiBarHorizontal" 
							tm1-data-decimal="0" 
							tm1-axis-label-x="" 
							tm1-axis-label-y="" 
							tm1-hide-controls="true" 
							tm1-height="300" 
							tm1-margin="{top:10,bottom:25,left:100, right:0}"
							tm1-legend="none" 
							tm1-color-scheme="myColorSchemePC"
							tm1-state="{{selections.department}},{{selections.Color}}"
							tm1-options-override="optionsOverrideDepartment">

							<tm1-ui-chart-dbr 
								ng-repeat="department in lists.department" 
								tm1-label="{{department.Name}}"
								tm1-instance="dev"
								tm1-cube="General Ledger Reporting" 
								tm1-elements="{{selections.version}},{{selections.year}},{{selections.month}},{{selections.region}},{{department.key}},All Suffix,{{selections.driver}},All Comp Status,TY,BASE,BASE,Total Distributed">
							</tm1-ui-chart-dbr>

						</tm1-ui-chart>

Hi @wlee,

That is just a variable name and you should be able to name it differently.

As for yesterday’s difference, I think it is because you have used a different property in the json:

As compared to now:

For reference purposes, this is where you can grab all the other properties available to work on:

http://krispo.github.io/angular-nvd3/#/multiBarHorizontalChart

Lastly, for click actions, as long as it is supported (see Help documentation), through the attribute will be the preferred route so that you do not need to type a lot of things. You just then call on the function you wanted to when user clicks.


Paul