The customer would like to have a Top X and “Others” to show on a chart in UX, we are scratching our head and doesn’t seems to be able to find a solution.
One “possible idea” is to have a calculated column in UX that group all the Non Top X together, however, this require “hardcoding” in UX.
Is there a way to create a “dynamic” formula in UX so that we can have an “Other” together with Top X and hide all the “Non Top X” elements?
I think you can make this work if the top “X” is a known number, like always top 5 or top 10. Then you could have MDX to return Total and the top 5 and then in UX insert calculated rows to sum the top 5 and take difference between total and top 5 for Other. (Come to think of it you could probably do it 100% in MDX with calculated members but the MDX is going to get very long).
But if the “X” is variable then it isn’t going to be possible as the solution requires either hardcoded logic in the MDX calculated members or in the UX calculated rows.
Or if you are OK with a bit of TI automation then you could always have a button to refresh the analysis in the report and use TI to hardcode the analysis into a separate small reporting cube.
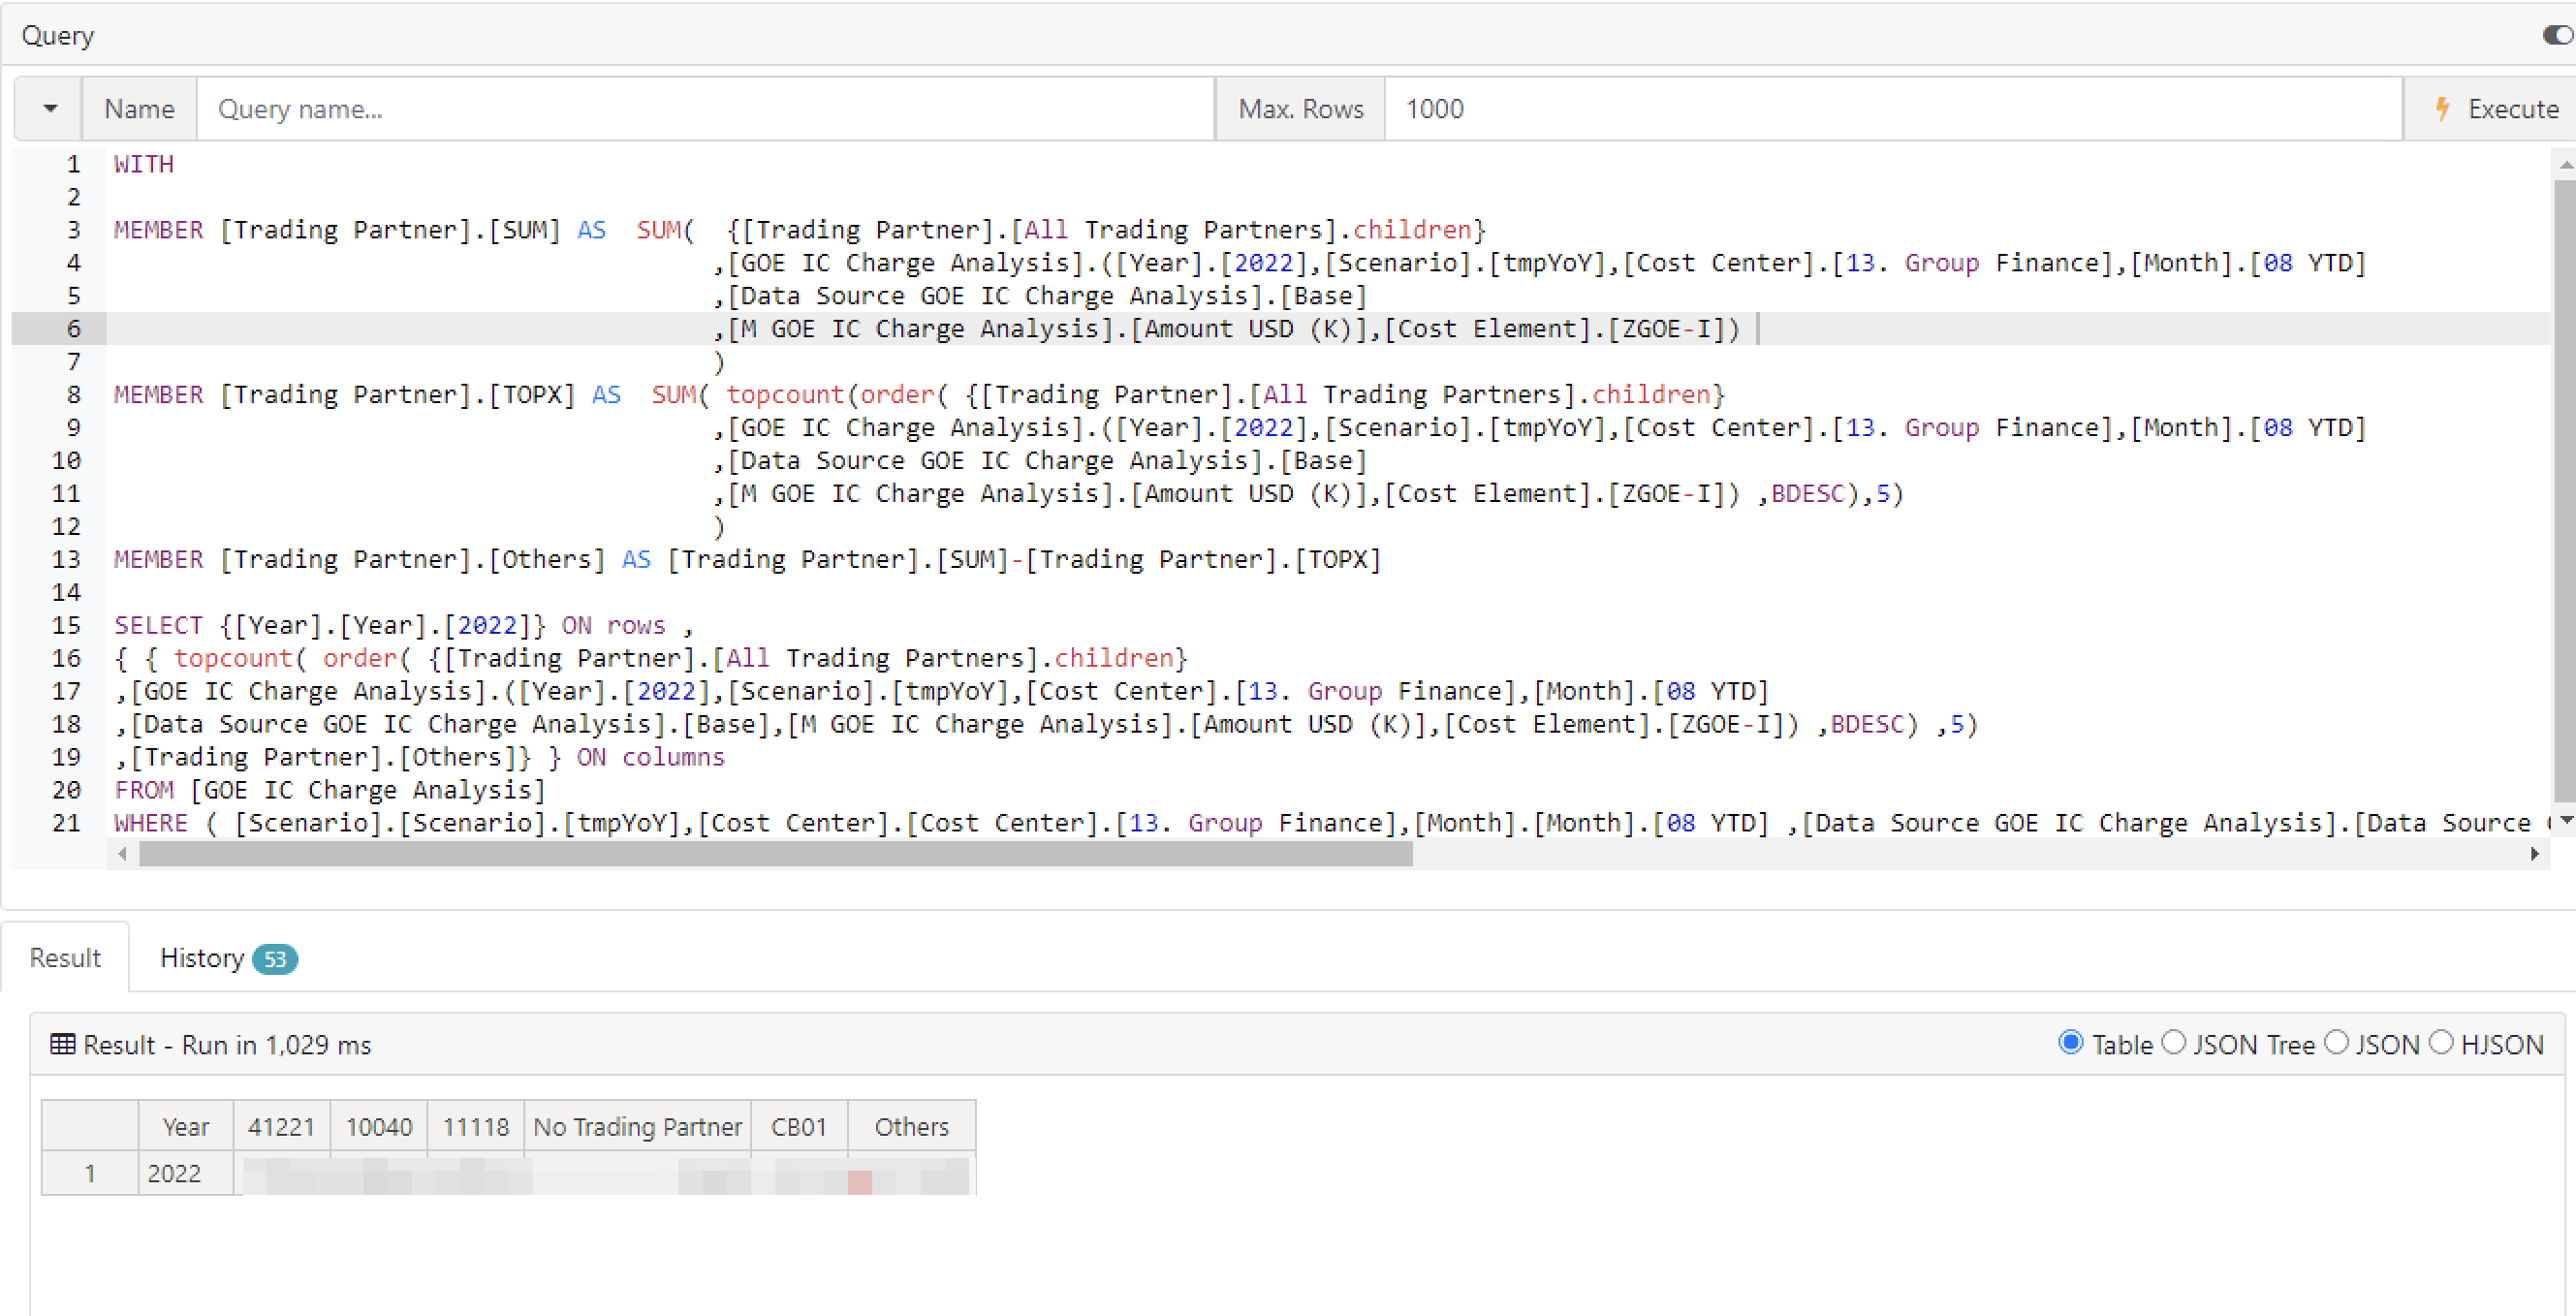
If you go on the full MDX query path and Calculated members as @cw-ch-scott mentioned, it should work!
Can do using “SUM” and “Except” of the top x to do the calculated member of “Others”.
For the Top X to be dynamic, if you create a dimension to add on the Global filters with the numbers list, and use as UX variable in the query it should do the Trick!