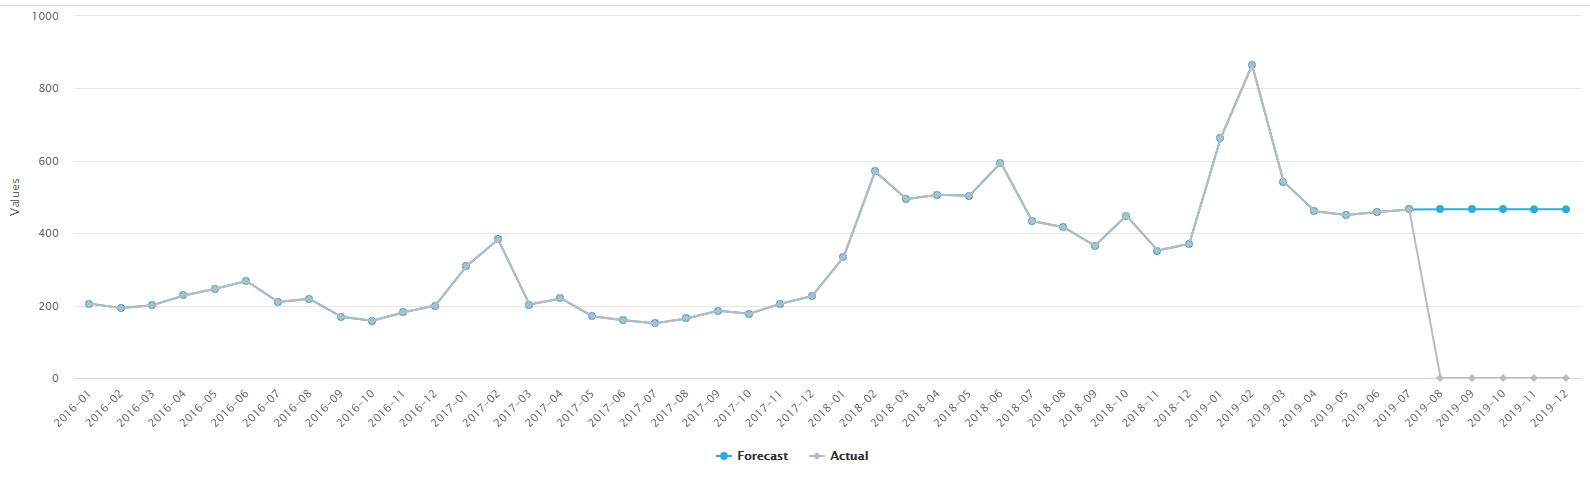
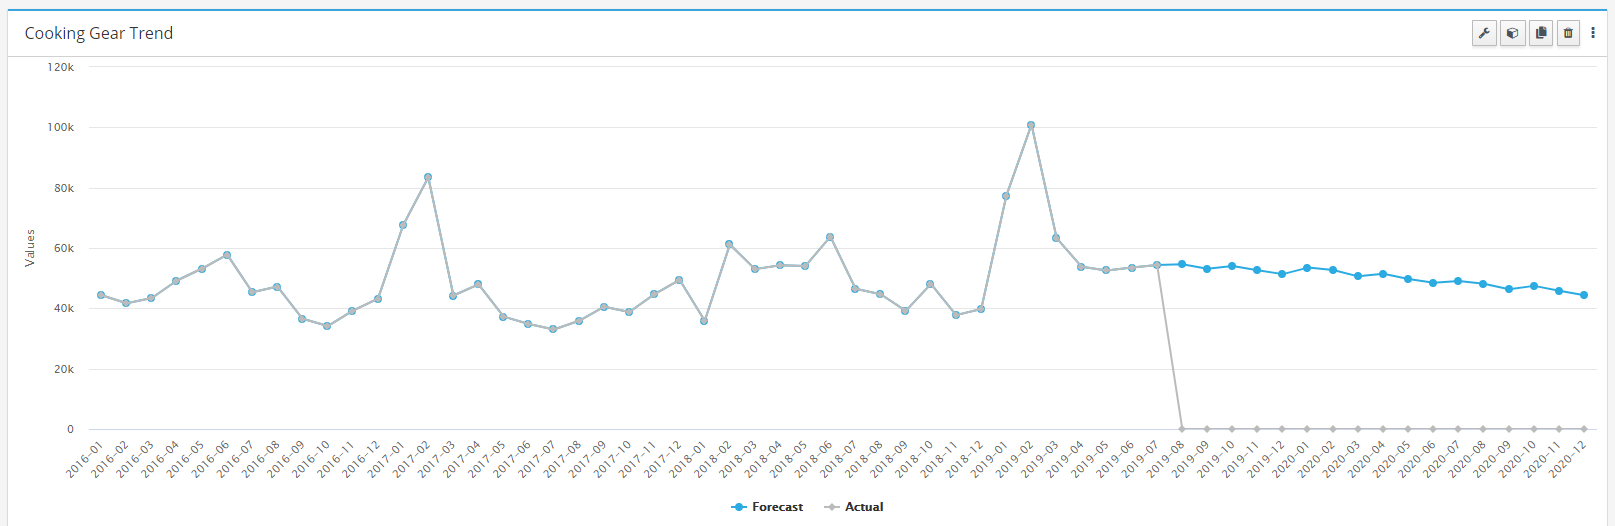
I am trying to build a stacked line chart with actual and forecast versions where actual version only contains data on actual months and forecast only on forecast month.
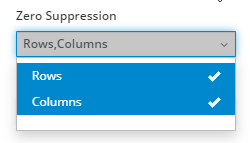
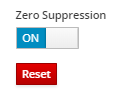
Essentially it works except that it does not suppress zeros for actual version.
@Ulas is doing the zero suppression correctly. If the “Forecast” series was not part of the resultset the actual values wouldn’t appear either. But when you change this chart to a grid you will actually find that there are “0” (zero) values returned for the actuals, which are then displayed. Highcharts would not display those values if they were undefined / null. There is no out-of-the-box option in highcharts at the moment to treat zeros as nulls. Depending on the use case there could be workarounds using zones on the x-axis (cp. for example: Hide line when zero (but not by setting to null) - Highcharts official support forum ) but it would probably the better options to handle it through a bespoke option in our component that could strip out zero values from the dataset before passing it into the chart. I will add this to our enhancement list.
Is that real undef values or just nulls/zeros formatted to be blank?
@aalex we did talk about this ages ago as a good feature for charts whether to plot zeros with a configurable true/false option. There would need to be some limited “smarts” around it e.g. subsitiute leading or trailing series of 0 with #NA in the Highcharts data frame (0s within the data series should still be plotted IMO just leading and trailing not).
In the meantime could @Ulas run a js function to basically do a find/replace for 0 to #NA in the grid before Highcharts renders?
If it’s real undef values @tganz then that is something else that we should definately pick up and convert into #NA or #UNDEF values that Highcharts can interpret as NA and not plot.
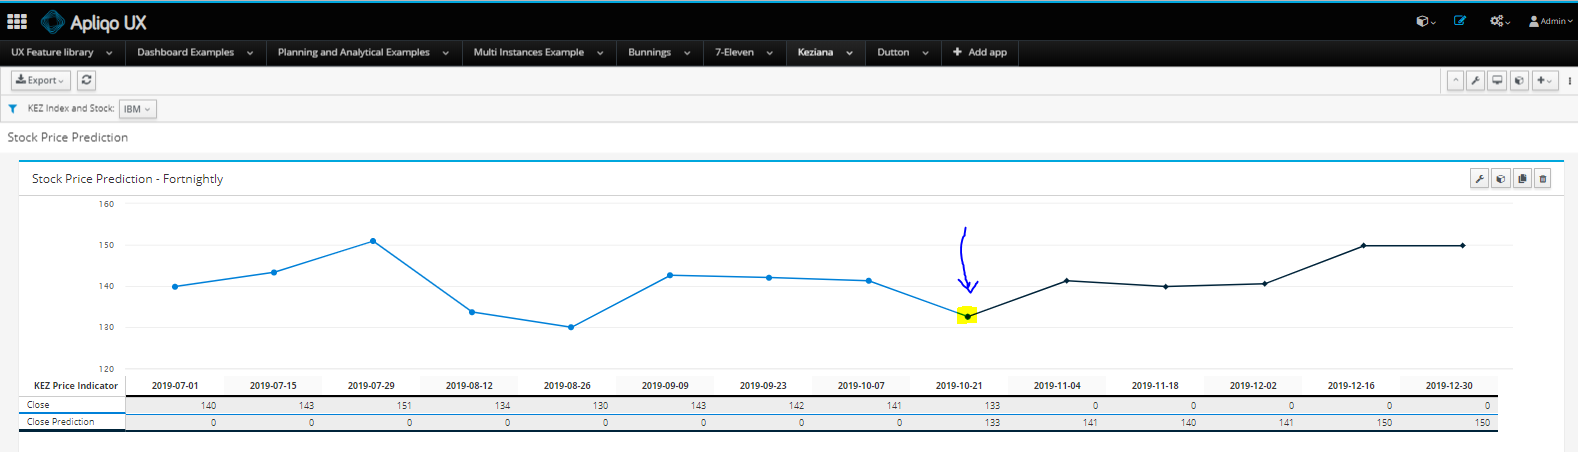
Hi @Ulas, I understand the problem now and have the same experience. However, the suppress zero works when I changed to “Table + Line Chart” type. The blue line is actual and black line is forecast.