Hi,
How do I present my small-multiple charts to be together and not separately?
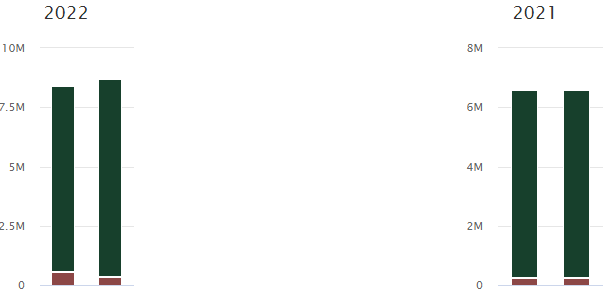
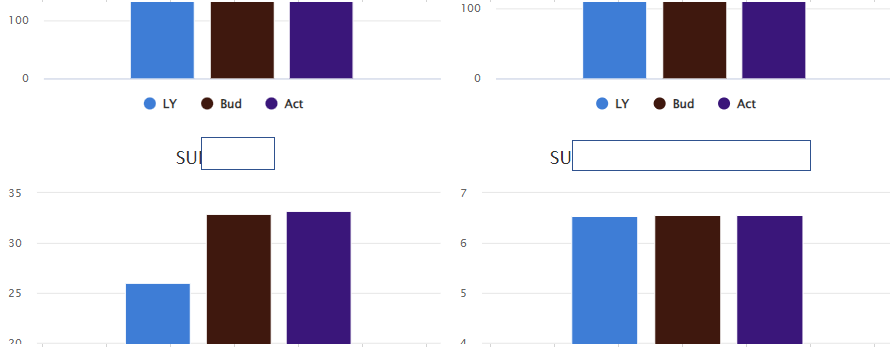
Output (something like this)
Thanks in advance
Hi,
How do I present my small-multiple charts to be together and not separately?
Output (something like this)
Thanks in advance
The only way to do this is by building and custom HTML widget and inside the widget repeat chart-widget directive By desired list elements
Hi MFS,
I got similar problem as yours when using small multiples.
Sometimes the size of each small chart is ok in edit mode. Once you commit the change, the charts always shrink in read mode.
Then i tried limited to 2 charts on one row, it seems working now, the size display is good to me (literally I come back to the dashboard with small multiples from other reports for over 10 times lol)
You can find the doc in advanced option
  "smallMultiple": {
    "maxChartsPerRow": 2
  }