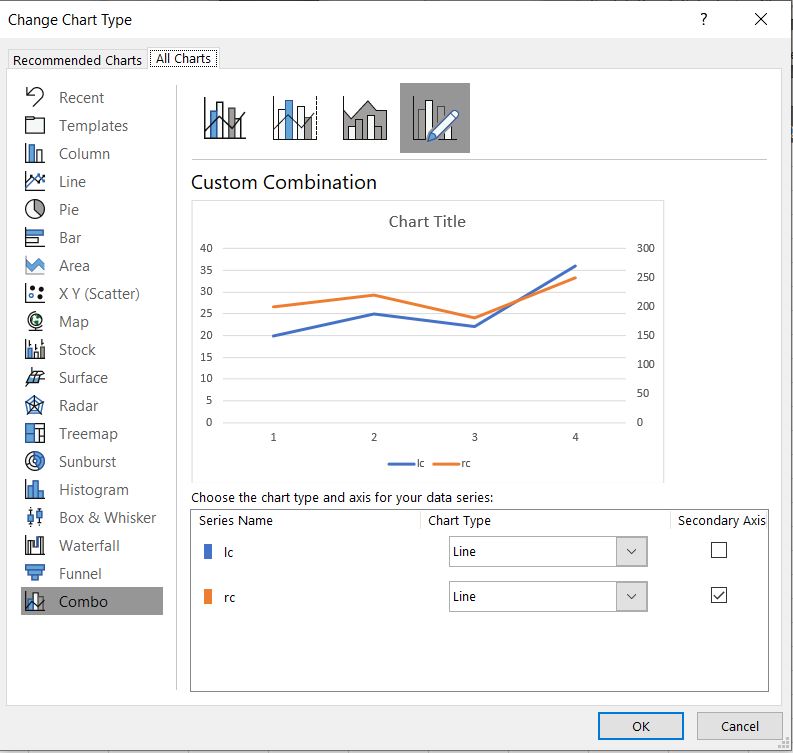
I’d like to use a secondary y-axis in a line chart in UX. On the Highcharts site I’ve seen this is possible and they call it Multiple Axes. But I don’t know if the y-axis property has been implemented in UX. Anyone who knows how to do it in an easy way?
See the example below from Excel.
@lcusiel,
I’m not sure how much of the chart options array you can edit in UX, but to add additional y-axis in Highcharts you need to create an array within the y-axis part of the options that has multiple declarations, like this:
yAxis: [{
              title: {
                text: ''
              }
            }, {
              title: {
                text: ''
              },
              opposite: true
            }]
Jack
1 Like
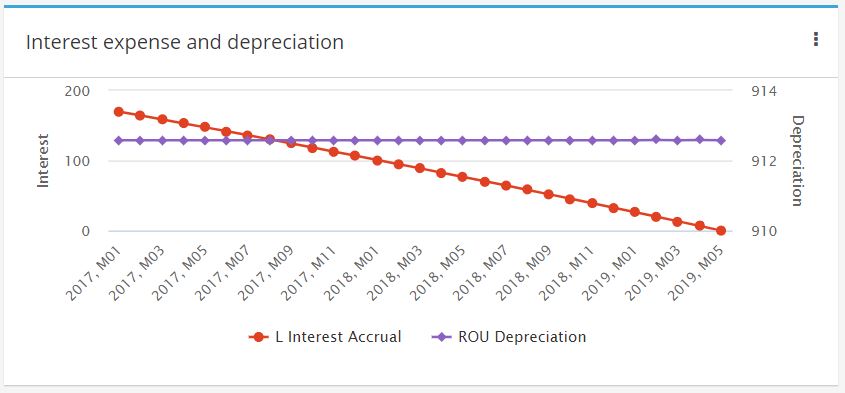
Hi Jack, thank you for pointing me in the right direction. I also needed to assign the additional y-axis to the right series. See the code below. Kind regards, Luc
“chartOptions”: {
“yAxis”: [
{
“title”: {
“text”: “Interest”
}
},
{
“title”: {
“text”: “Depreciation”
},
“opposite”: true
}
],
“series”: [
{
“type”: “line”
},
{
“yAxis”: 1,
“type”: “line”
}
]
}
@lcusiel
Correct, Highcharts won’t render any axis if there’s no series associated with it.
Unless you use min and max tick values for the axis, then they I think they would appear regardless of series definitions.
Jack
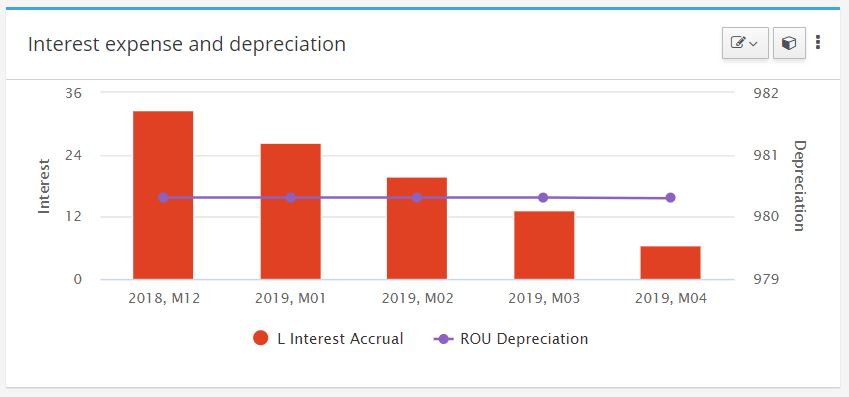
It’s also possible to create a combo chart. 
For TM1 Horizon @rcantor will be showing lots of fancy highcharts stuff.
1 Like
Yes I know, I will be his host