How do I do routing in Canvas? Let say I would like to do something like:
http://localhost:8080/#/PnL/CompanyB where PnL is a dashboard built on Canvas, and we would like to pass CompanyB as the element name, so that PnL will display data from CompanyB only.
I think this should be quite a common request, just wondering what’s the best practice of doing that in Canvas.
The Navigation sample shows how to do routing, the Printing example will show you how to use URL parameters. Either will work in a similar way, URL parameters are more flexible but the routing option looks cleaner.
Thanks Paul and Tim, I think the URL parameter probably works better for me as I may need to pass multiple parameter and if I can seperated with a “&” sign, it looks more nature to users comparing to routing.
Will give it a try and let you know if I hit any problem.
Although you can always convert the JSON to its string representation (i.e. via angular.jsonTo() function), this may not be a good practice to begin with. For one, URLs normally has a 2000 character limit. Then checking that by itself can become very complicated if it is off by one character, etc.
Regarding item#2, if you need to retrieve it from TM1 or from data sources, you can always just store the ID of the object itself in the URL parameter and retrieve that when the page loads. If the directive that you are using does not support dynamic parameters, you can always put all of it within a DIV and utilize an ng-if to re-initialize it.
With this, you could always just retrieve the data and if the directive that you are using has a watcher on it - chances are, you do not need to do something on the HTML side. You just need to ensure that you have captured the changes and the URL and update your object that you feed into the directive correctly.
Hi @tryan,
It is nested objects.
Thanks for those are quite handy libraries - Im leaning towards @plims suggestion though, but I will try them out also and see.
Hi @plim,
I see your point in par1.
I will test out your suggestion in par2 above - may lose some performance, but overall should be the simplest approach/most troubleshoot friendly.
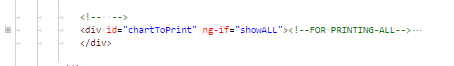
I went for the option of “…put all of it within a DIV and utilize ng-if to re-initialize it”
I’m still making a mistake somewhere/misunderstanding a step though.
With this step you do not have to adjust your URL?
To be honest, I dont understand exactly how phantomjs picks it up from here in the backend?
Does it rebuild the page behind the scenes, injecting variables specified in the URL?
I added this div wrapper:
Current Flow and result:
When the page loads for the first time, the ‘showALL’ scope variable is set to true.
All JSON objects built and populated from TM1…once this is done, the UI is updated. (graph rendering/values etc)
User clicks on division button = modal pops up = user selects a division
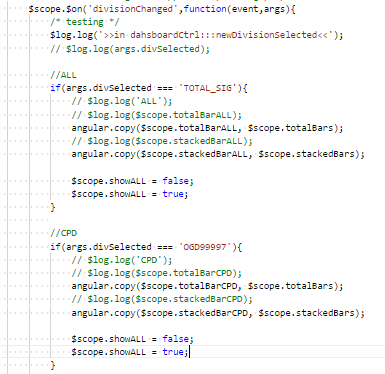
When he selects a division, broadcast is fired to the the controller scope and this code runs (extract):
$scope.totalBars and $scope.stackedBars are the objects which are linked to the graphs and they get updated, depending on which division the user clicks on (CPD is a division and there is only 4 divisions)
The idea behind it is to let it be removed by angular on 1 cycle, and then let it be re-initialize on the another cycle (the 50 ms delay).
Then regarding your scenario, if the user will need to click on a button, the action or parameter of this button should be placed in the URL. There is a sample of codes within the Printing page that shows you how you can do that.
The final check of the page would always be when you press F5 or when you refresh the browser with that URL - it should show the page in how you wanted it to be.
Looking at the URL you have posted, it does not seem like you have parameterized the URL yet.
If you have a pop up that allows user to select a division, then ideally you would save this up in the URL like division=TOT_SIG or division=OGD0000, so that when the page is refreshed and you have detected that there is a division passed as a parameter in the URL, you would initialize your graphs with that.