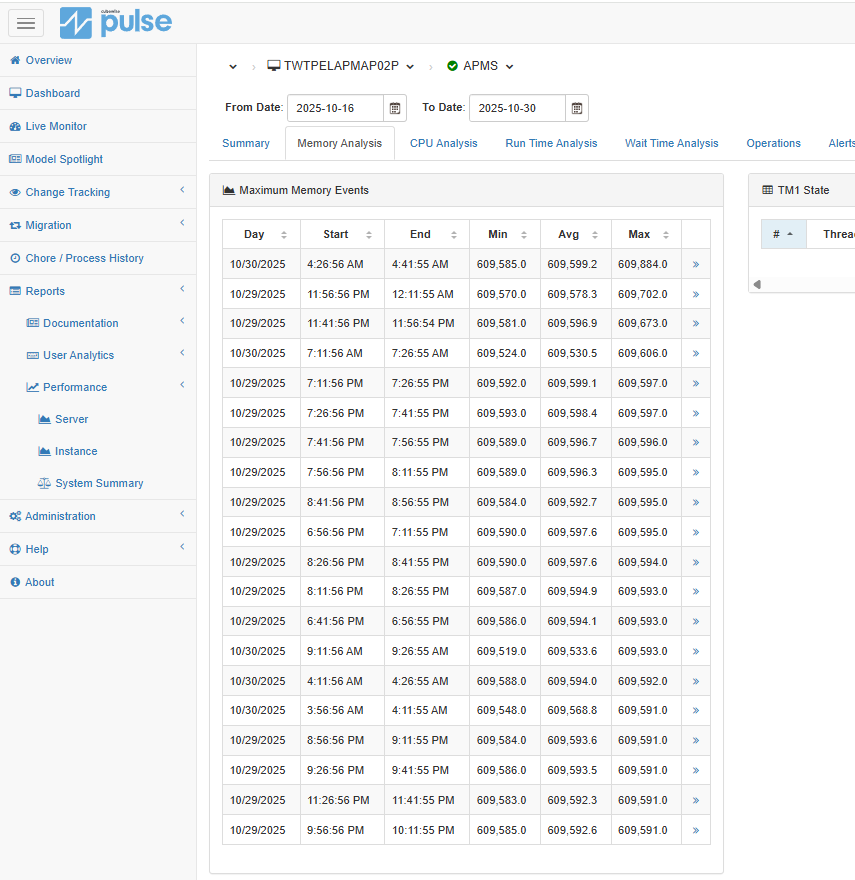
I have a question for pulse. As the figure below ,although the time range was set to two weeks, the output only returned two days of data, which seems inconsistent. Could you advise if this suggests a configuration gap on my end or a known limitation?
Hi Paul, I’ve already tried to sort the columns, such as ‘Date,’ and have also set the display limit to 100 items per page. Given these steps, I believe something may still be set up or functioning incorrectly
By design, this page shows the 20 biggest memory events during the time frame selected. I agree that it is not clear on the page that it will only show the top 20.
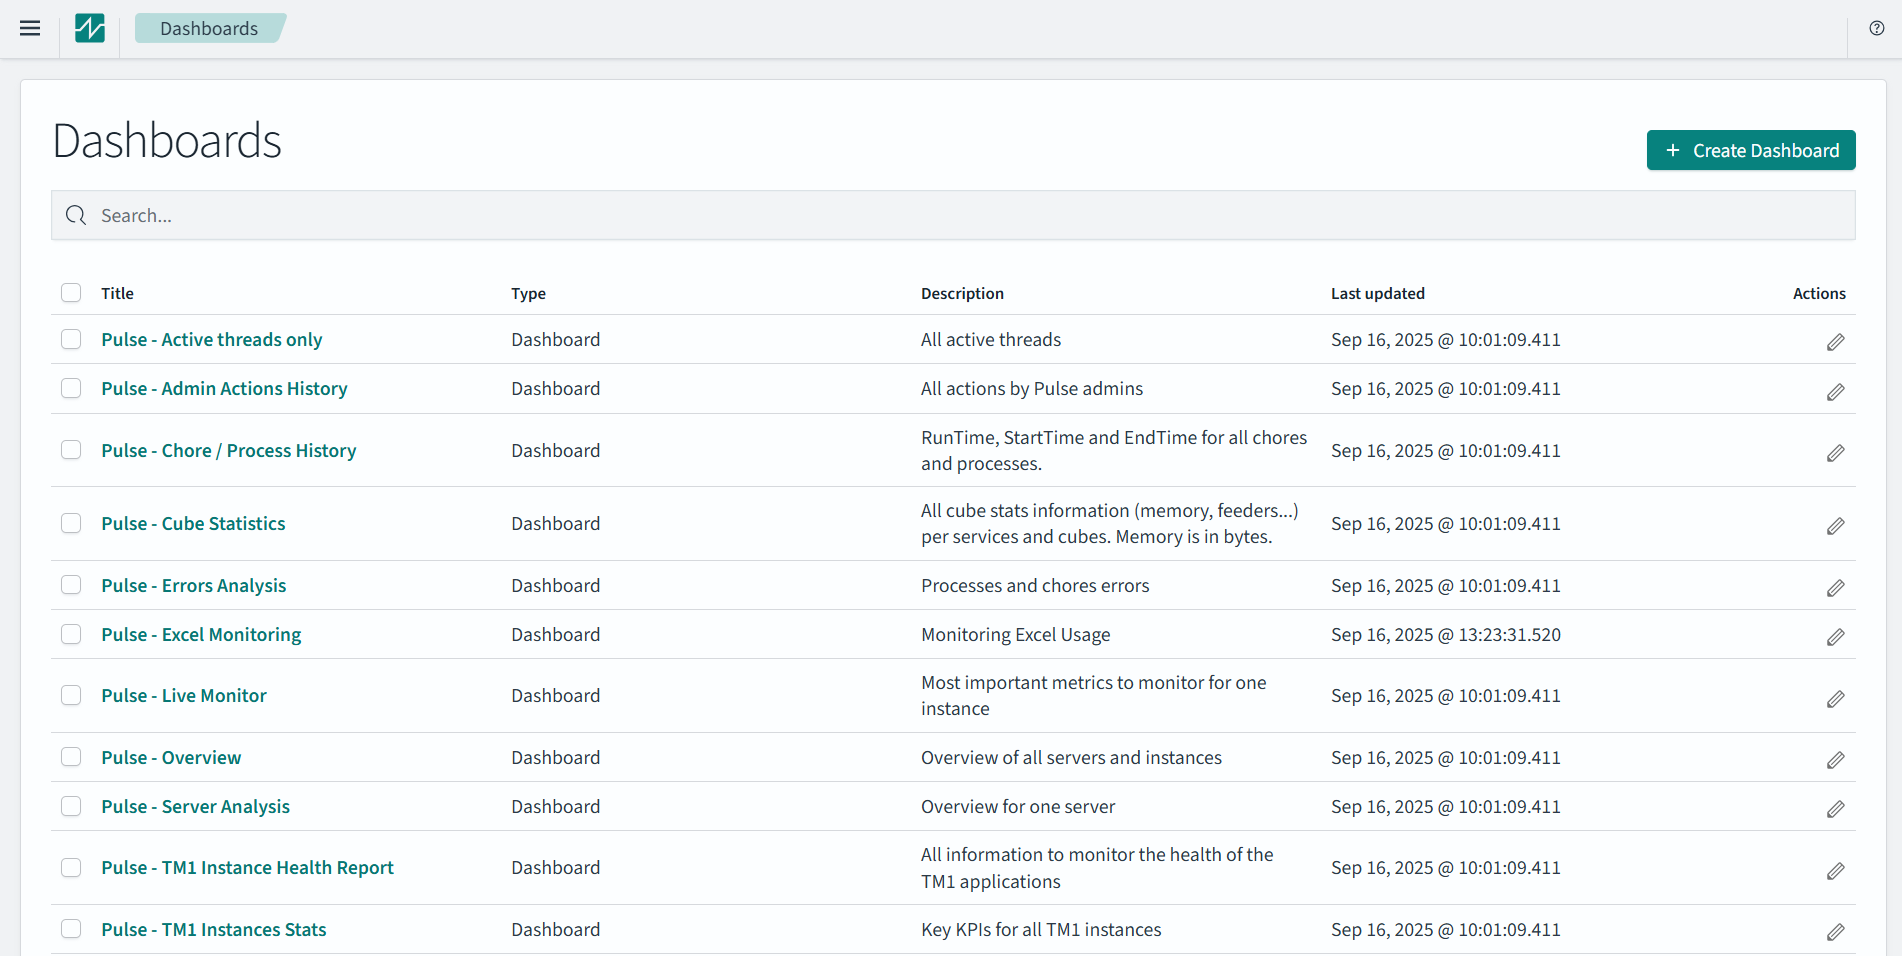
To do more analysis, I’ll recommend that you go to the Pulse Explorer, there are many pre-built dashboards to play with and you’ll have more flexibility with period: