Hi,
I need some assistance trying to understand what some of the metrics under the ‘pulse-tm1-session-history’ index mean, I’ll use one example below to illustrate the problem.
I’m running this query on the ‘Query Workbench’:
select
	ServiceName,
	DisplayName,
	LogInTime,
	LogOutTime,
	SessionTime,
	CommittingCount,
	RunningCount,
	WaitingCount,
	RollingBackCount,
	UserWaitingCount,
	LogCount,
	Product,
	Name,
	ThreadId,
	Id,
	timestamp
from
	pulse-tm1-session-history-2025
where
	WaitingCount > 0
	and UserWaitingCount > WaitingCount
	and DisplayName not like "LDAP/%"
order by timestamp desc
Below is the response for the above query:
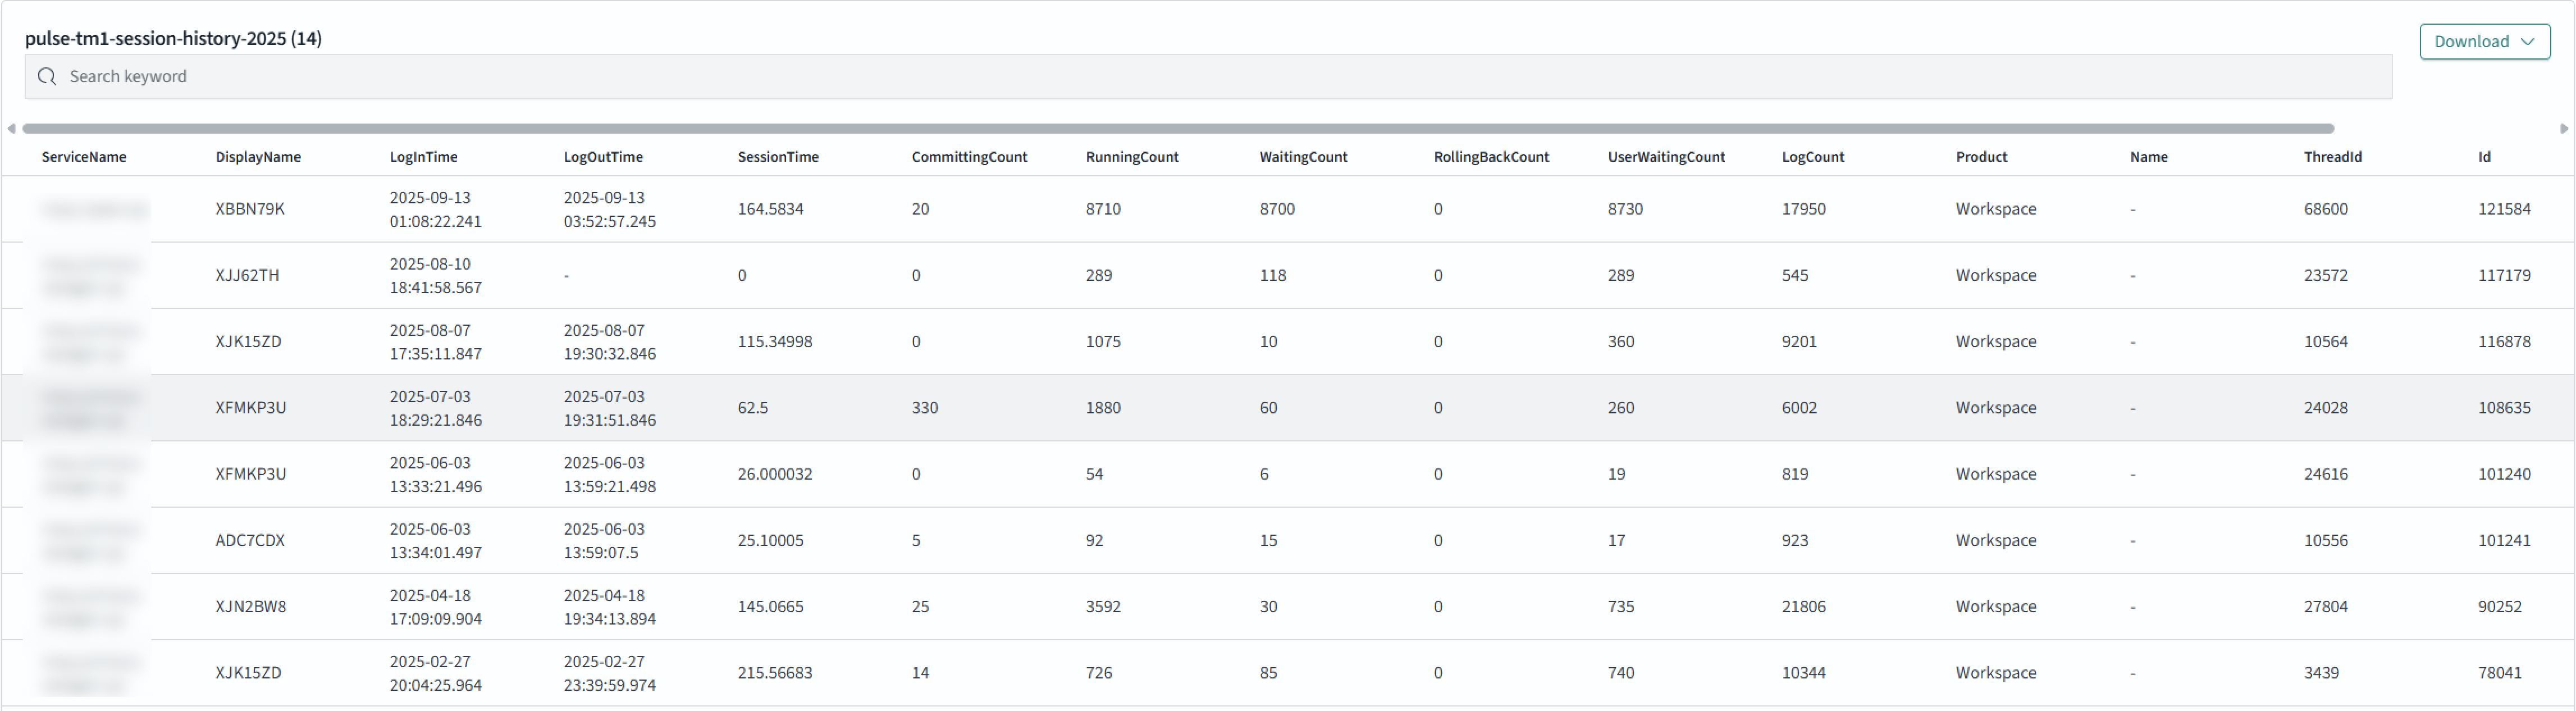
What is the difference between UserWaitingCount and WaitingCount?
Is it that one checks for user initiated threads that ended on Wait and the other tracks all others?
I’m using Visualize to see what’s behind these numbers and I don’t think that is it, below is a picture of what’s behind the 8,700 under WaitingCount:
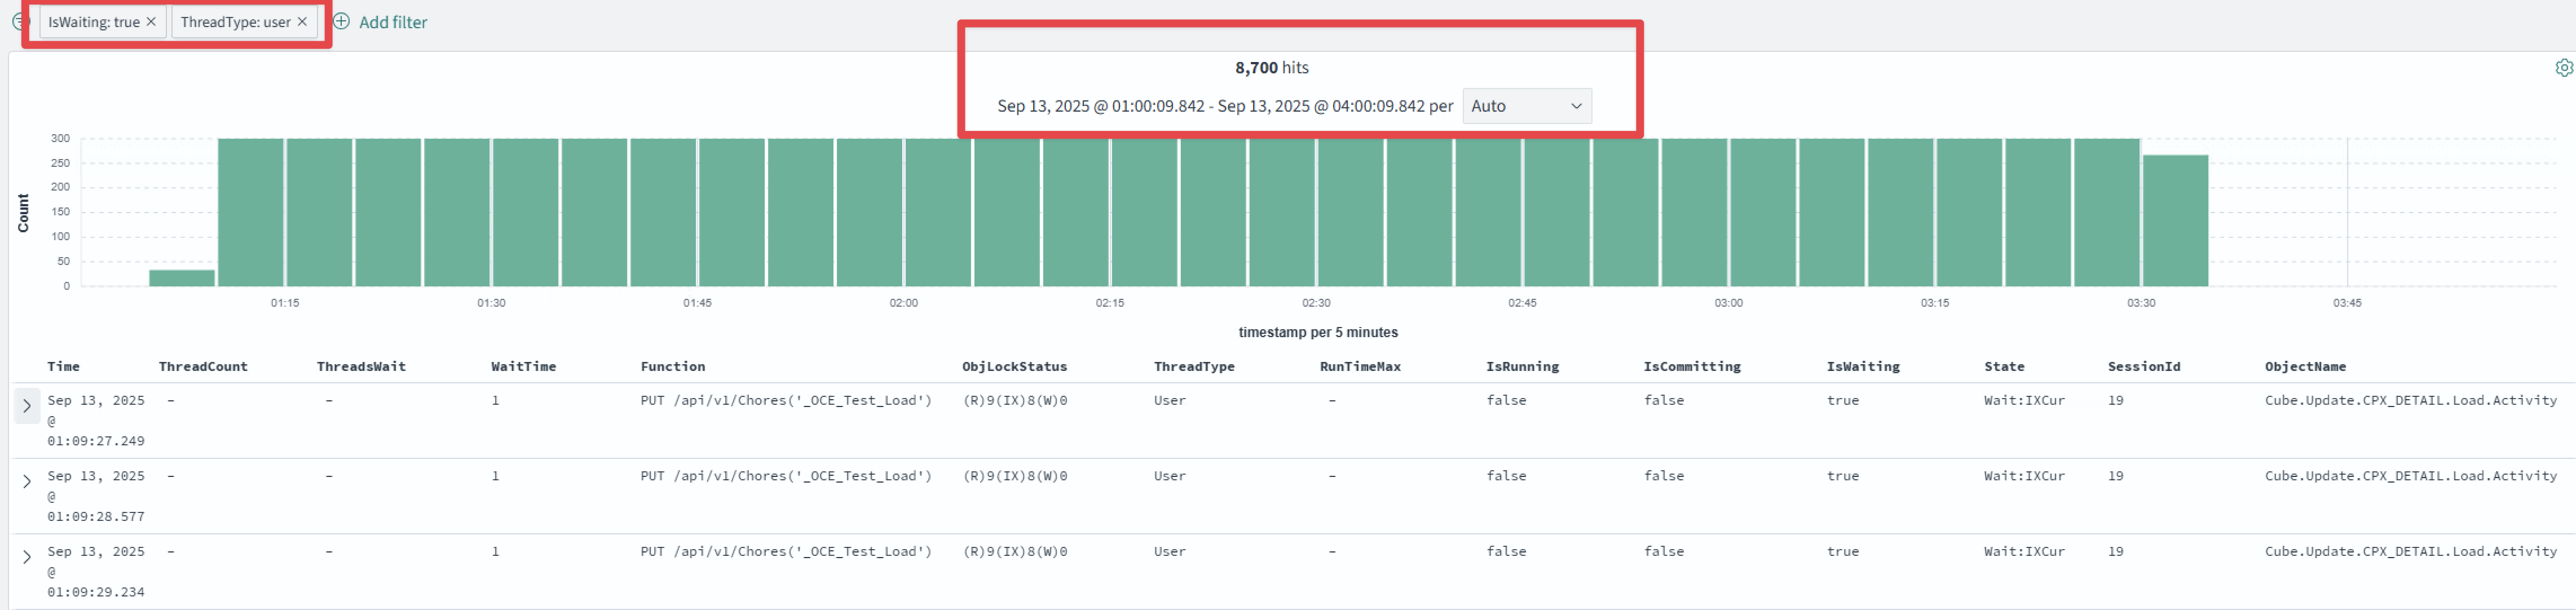
they are all ThreadType=User. So if WaitingCount can include user initiated thread, what’s behind UserWaitingCount? How could that number be higher than WaitingCount?
Any guidance would be greatly appreciated!
Cheers
nico