Pulse Database: Process Error Rate

Hi all,

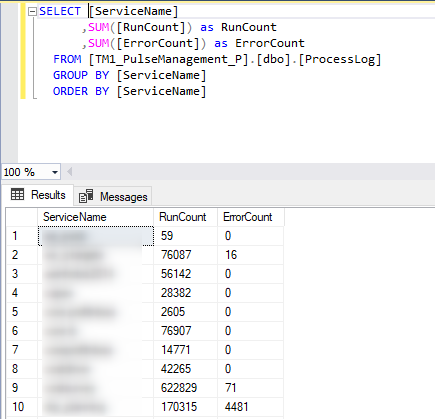
we currently want to use Pulse data for some more analysis: In our current case we want to query and report the error rate of TI-Processes for all TM1 instances on our environment for a given period. Therefore we had a look in the database and queried the table [ProcessLog].

It will give us the result (see screenshot), but it is only giving us the full history. Is there any other table we can query, so we can report the error rate for a particular month? (e.g. 01.05.2024-31.05.2024).

Thanks for any hint!

image

Hi @ecarmona,

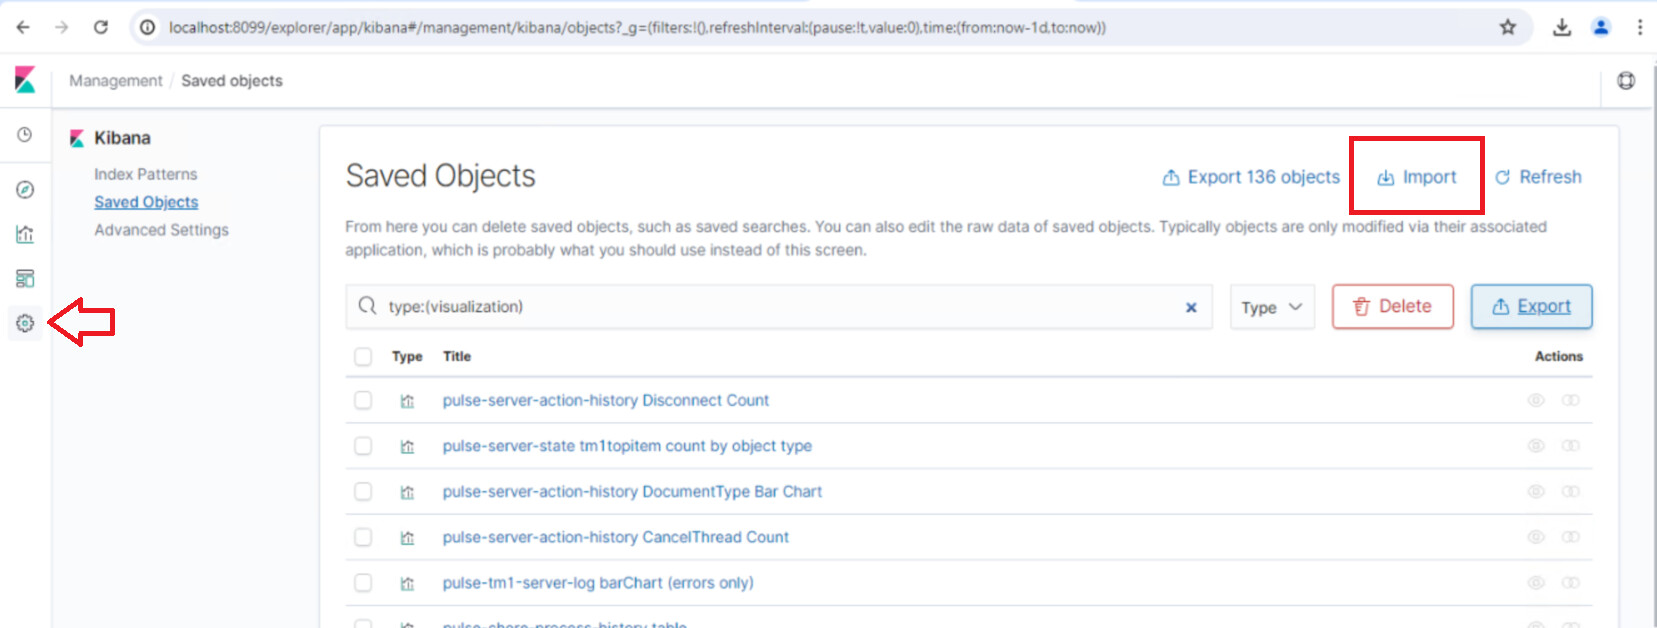
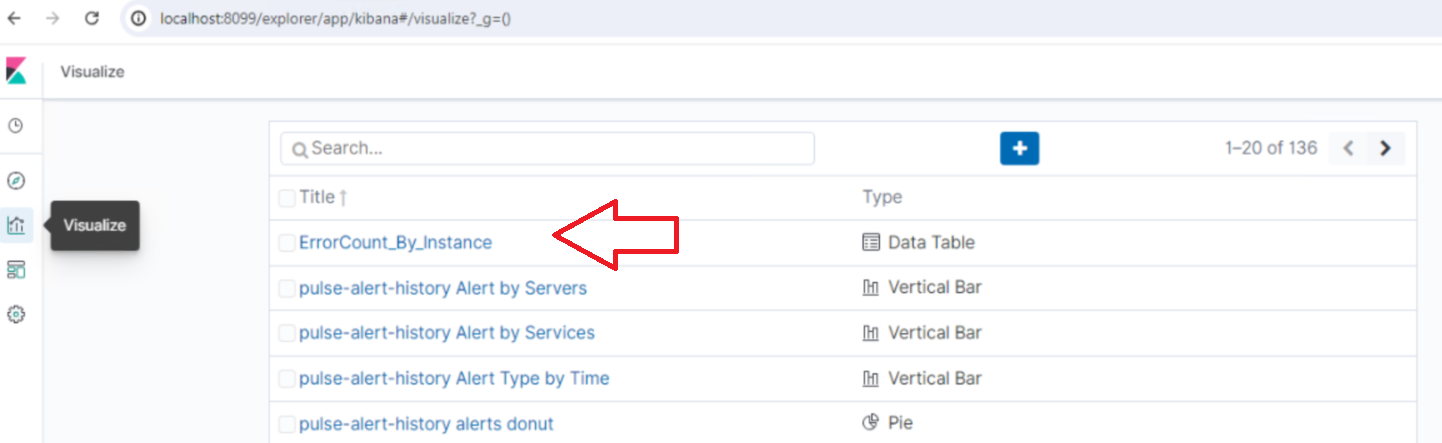
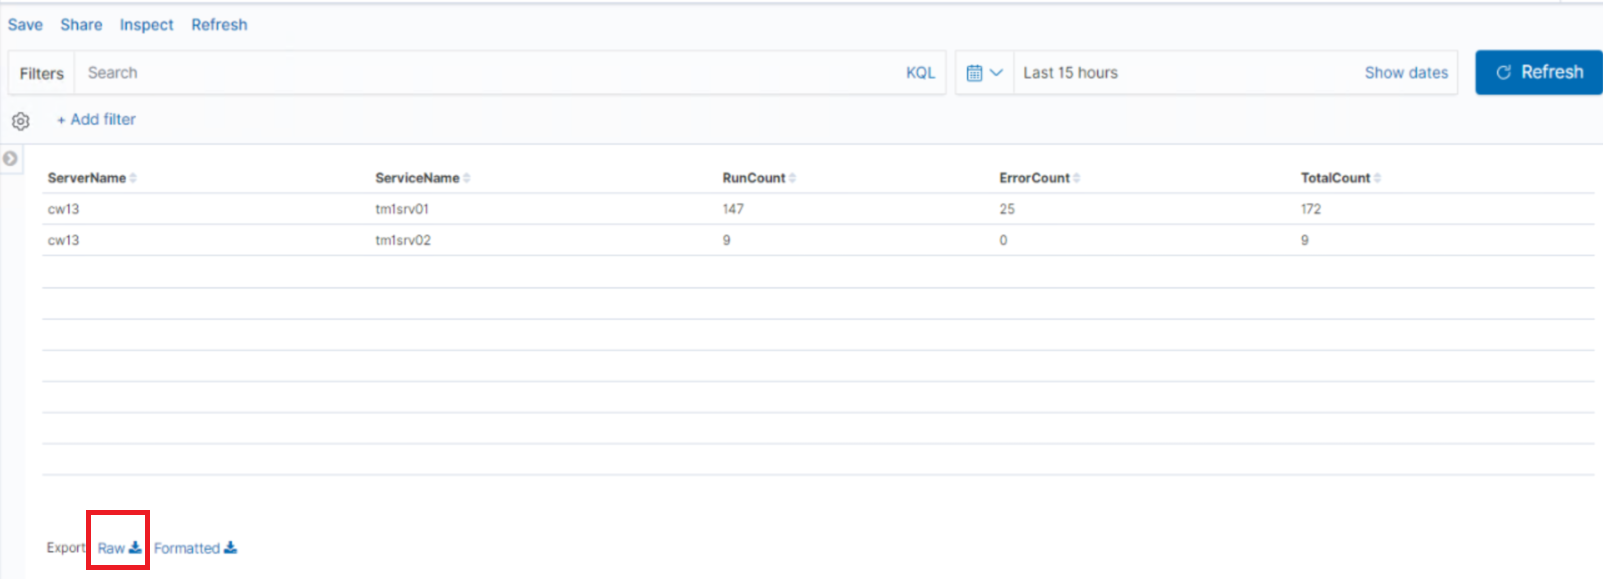
Are you familiar if we are able to pull this information from Elasticsearch? Or any existing report that can be used in Pulse Explorer for this already?

Cheers!

Paul

Hi @plim,

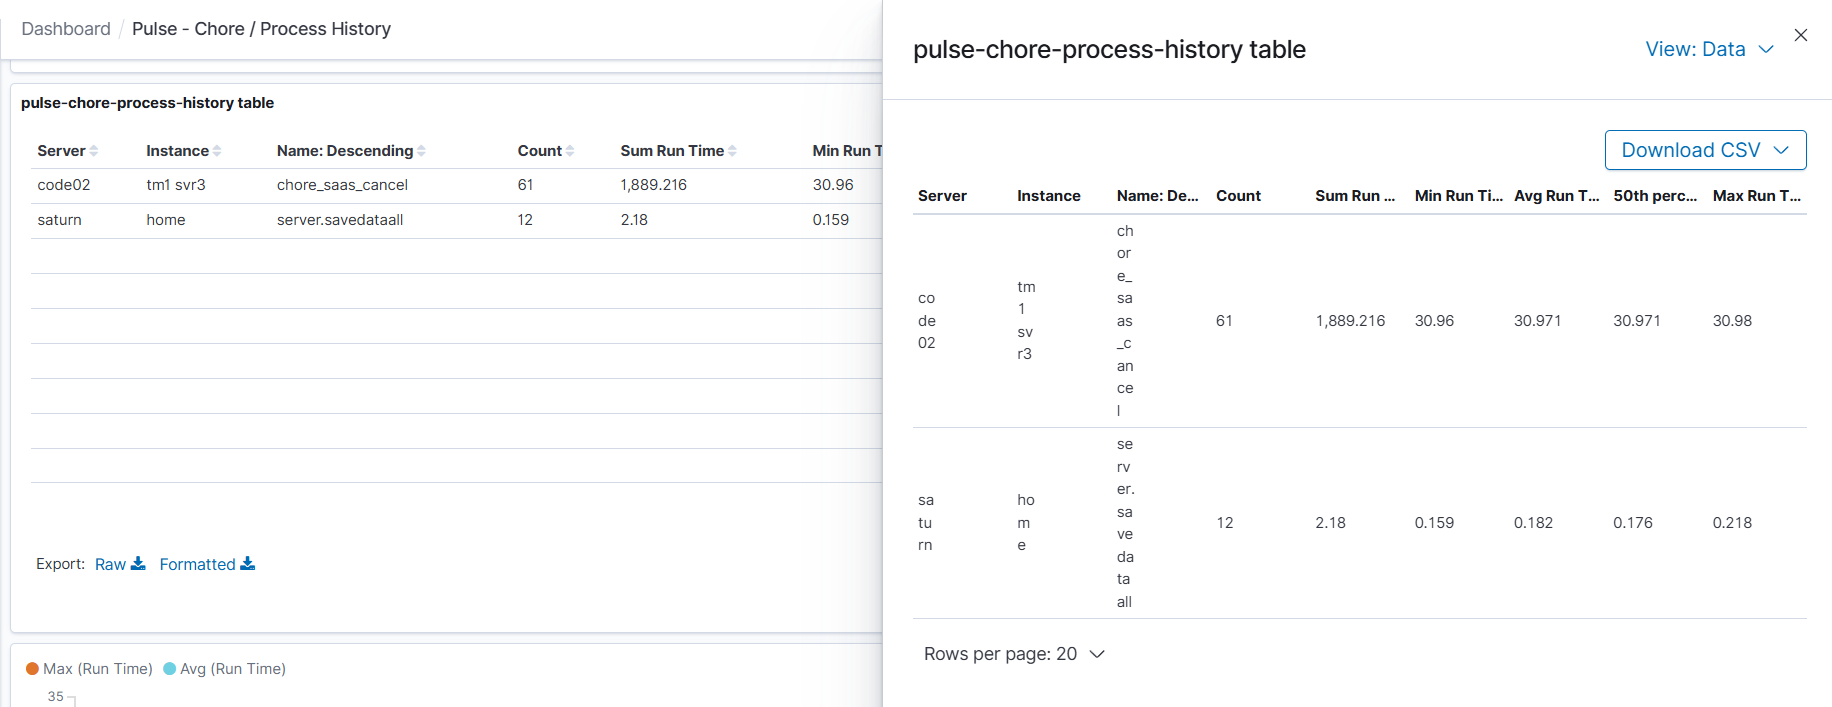
Yes, it is important to clarify that the mentioned table is populated from Elasticsearch. the pulse-chore-process-history* index can be searched in discover and produce a similar result. However, in the current version of Kibana there is no export feature to csv. In the coming release with open search, SQL queries can be executed against the Elastic indices and export the results to csv.

Regards,

Erik

Hi @ecarmona,

Like are we able to provide a sample filter on how to achieve the above?

Can they start off from Process and Chore History for example?

Do we have those RunCount and ErrorCount information readily available?

Cheers,

Paul

Hi Paul,

I will work something out and comeback to them

Hi @ecarmona, do you already have an update for us?

Thanks
Dominic

Hi Dominic,

I am still working on this. I will post it soon.

Regards,

Erik

1 Like

Dear Dominic,

I hope this message finds you well. Please upload the following file in Pulse Explorer:

ErrorCount_by_Instance.json (2.6 KB)

To do so follow these steps:

A) Open Pulse Explorer from the Pulse Web Application

B) Go to Management and Click on Saved Objects, then use the import feature to import the attached file.

C) Once the Visualisation is uploaded you should find Under Visualise/ErrorCount_By_Instance

D) Click on the visualisation and you will see a table with export to csv (called RAW export) as the following image:

Let us know if you have further questions on the above.

Regards,

Erik