I was wondering if anyone had any experience with Pulse being a top user of the server CPU where it was installed? My situation is that Pulse is installed on the TM1 server itself. This is owing to a lack of available resources.
After conducting a forced restart, there was a slight reprieve but I am concerned the situation may reoccur.
Thanks for that article. I have implemented an increased maximum allowable RAM usage. In any case, the usage was below the original limit.
I tested out stopping the Pulse services and noticed that most of the CPU usage went away. The main contributors to the overall remaining CPU usage were the Windows PowerShell processes. When I stopped Pulse, I noticed these PowerShell processes reduced but did not go away.
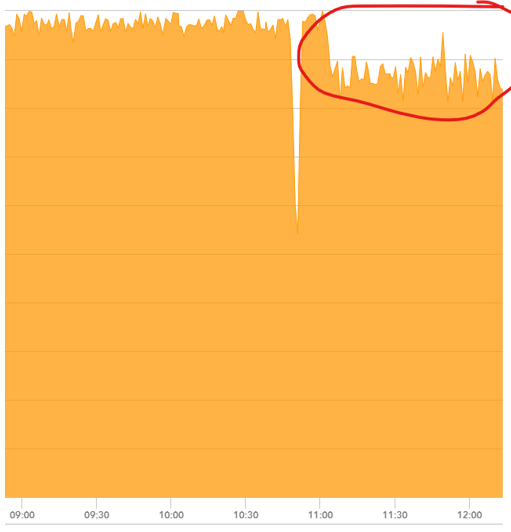
Turning the Pulse services back on, I confirmed the RAM usage remained below the limit set by a good margin. Unfortunately, the CPU usage went straight back up to 100% or not too far below. Taking a look at the history, it looks like the average across the 4 cores is about 95%.
Would Pulse happen to call PowerShell processes? This might explain I see an increase in CPU activity once I start up the Pulse services.
As for other symptoms, I cannot see anything notable in the TM1 services I’m running. Arc however seems to take a really long time to respond - it used to be much more snappy.
I have asked my IT team to take a look at the server for changes that might be resulting in additional CPU usage. Any insights would be greatly appreciated.
The Pulse monitor on my laptop constantly used between 15% - 20% of 16 cores (equivalent to 2 to 3 cores). It was using about 300 MB memory. Is this to be expected? There is very little activity on the servers. It did go down to about 2% and about using 16 MB after restarting the laptop.
@jmorison, I noticed PowerShell scripts that seemed to have an excessive impact, they went away when I stopped the “IBM Planning Analytics Administration Agent”, maybe have a look at that service if it’s running.
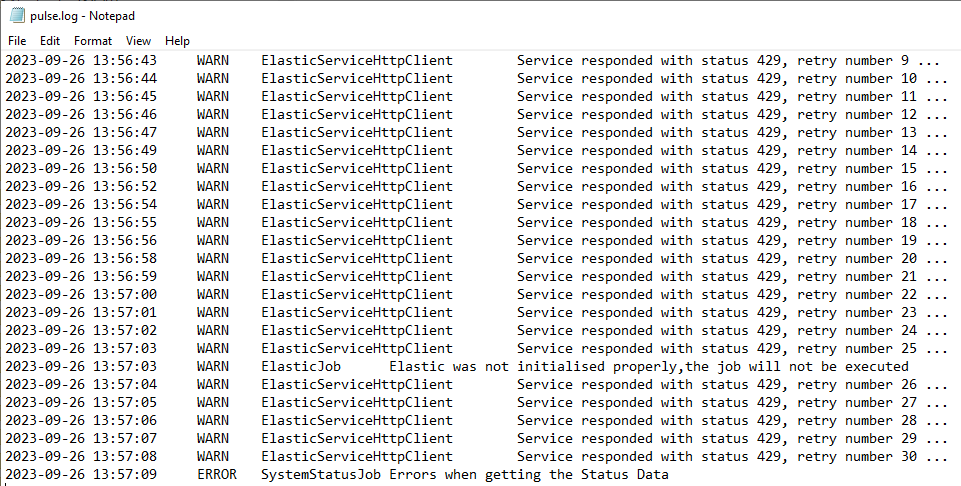
I have been taking a closer look at Pulse and have noticed a number of warnings flash up on the dashboard pertaining to the Elastic Search Server experiencing an error whilst installing. I pulled up the Pulse log and I seem to get plenty of retries. I’m wondering if this might be the cause of the CPU usage I have been experiencing.