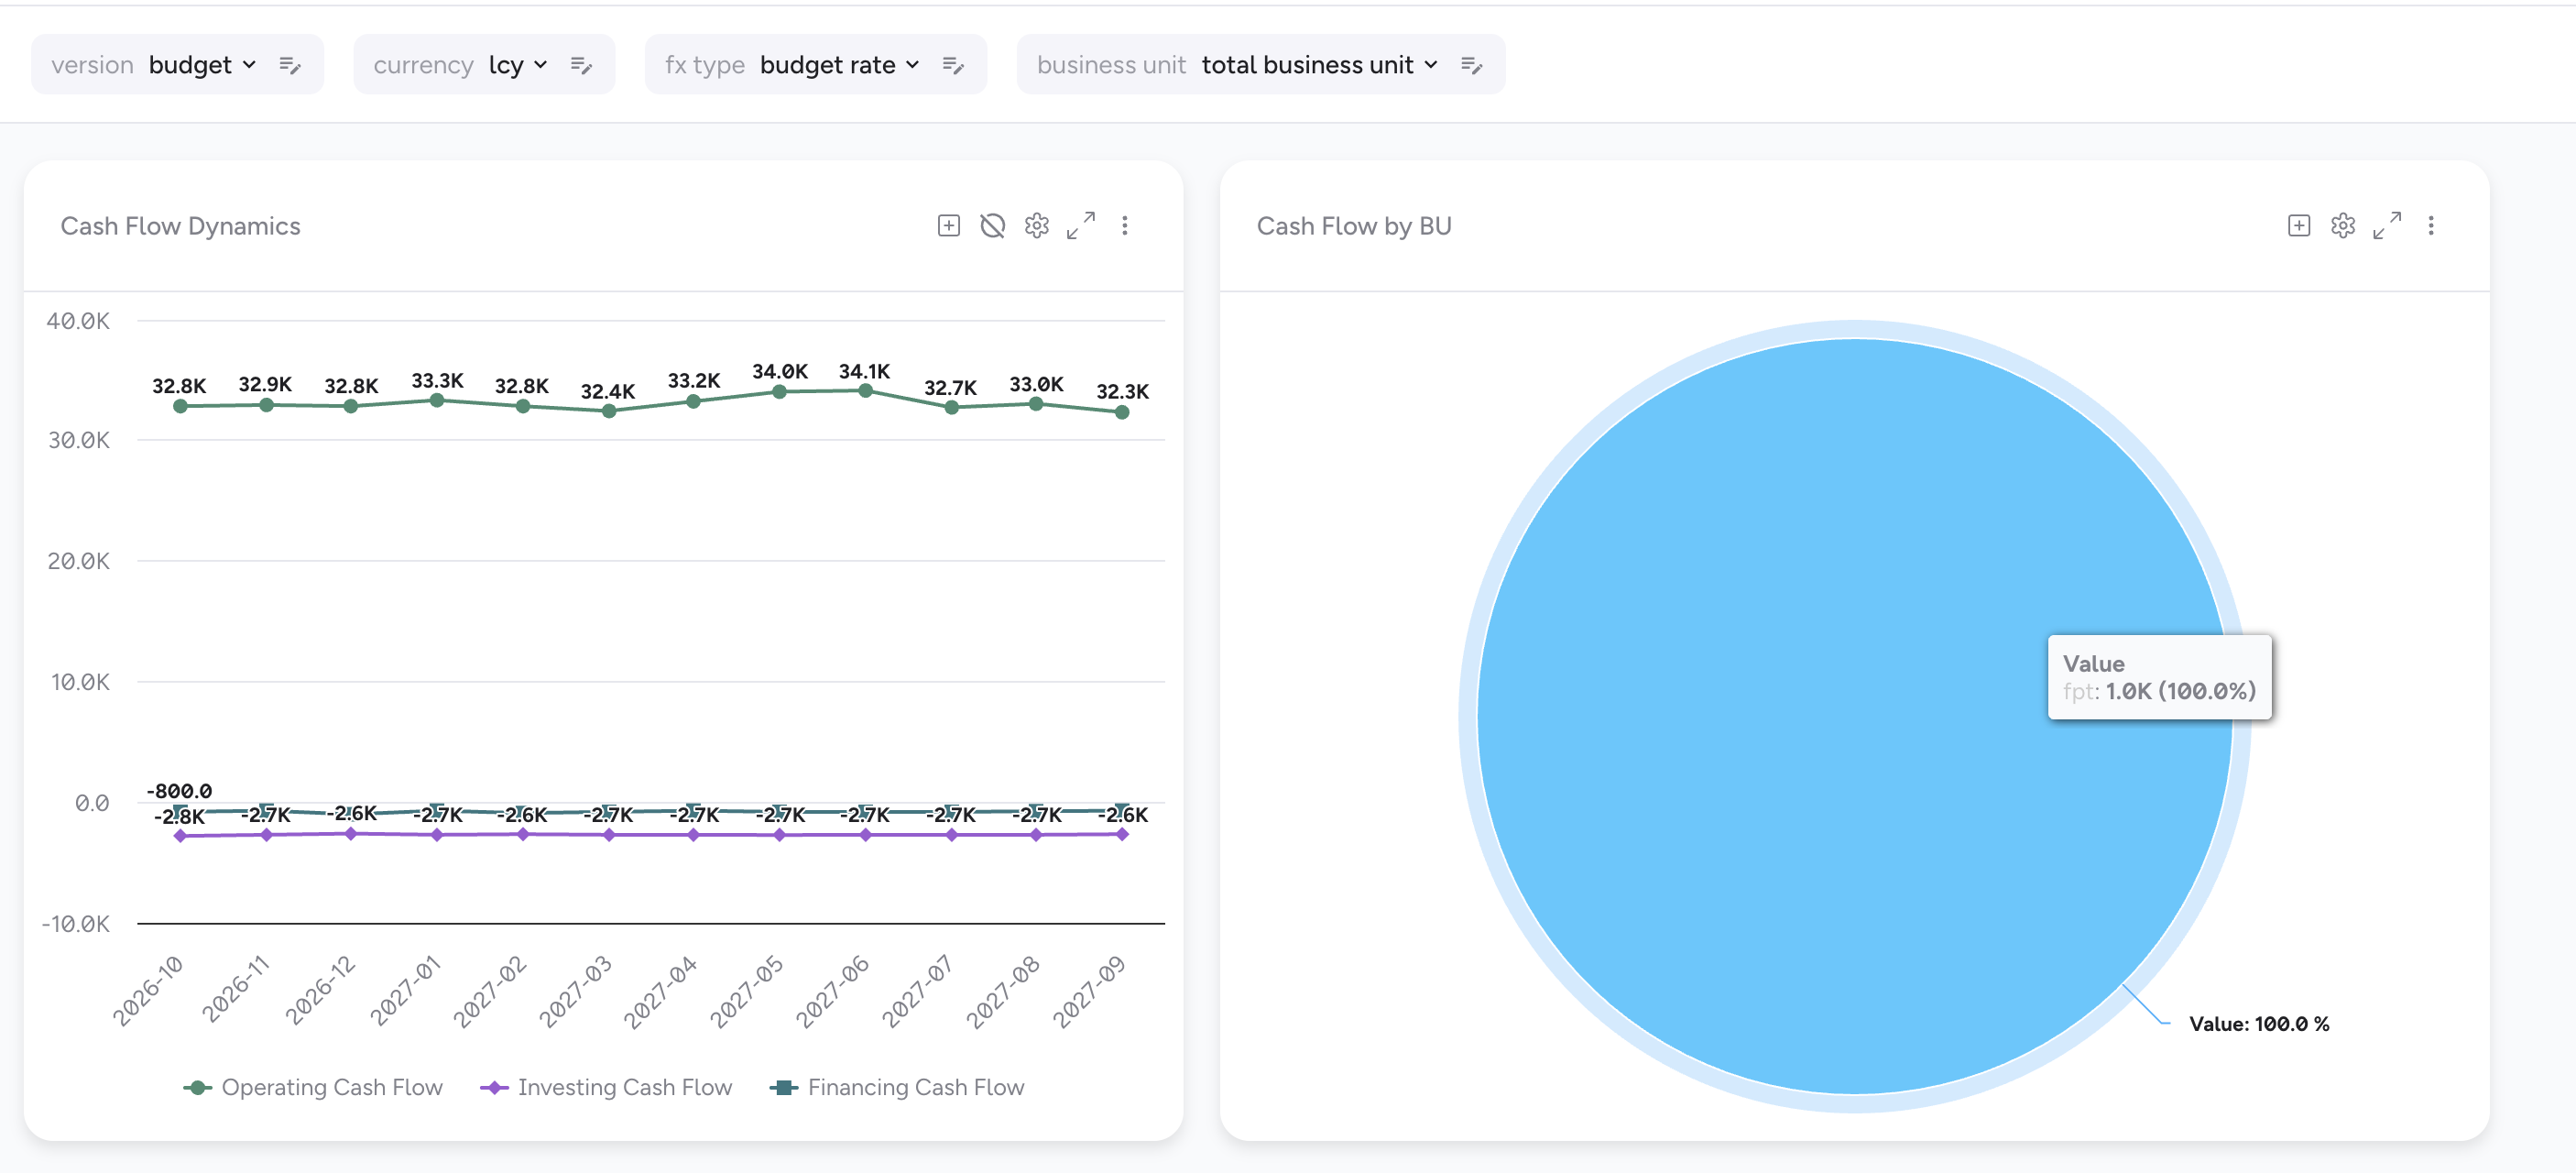
Hi Everyone. I am trying to create a Pie Chart in UX NextGen based on the tm1 view.
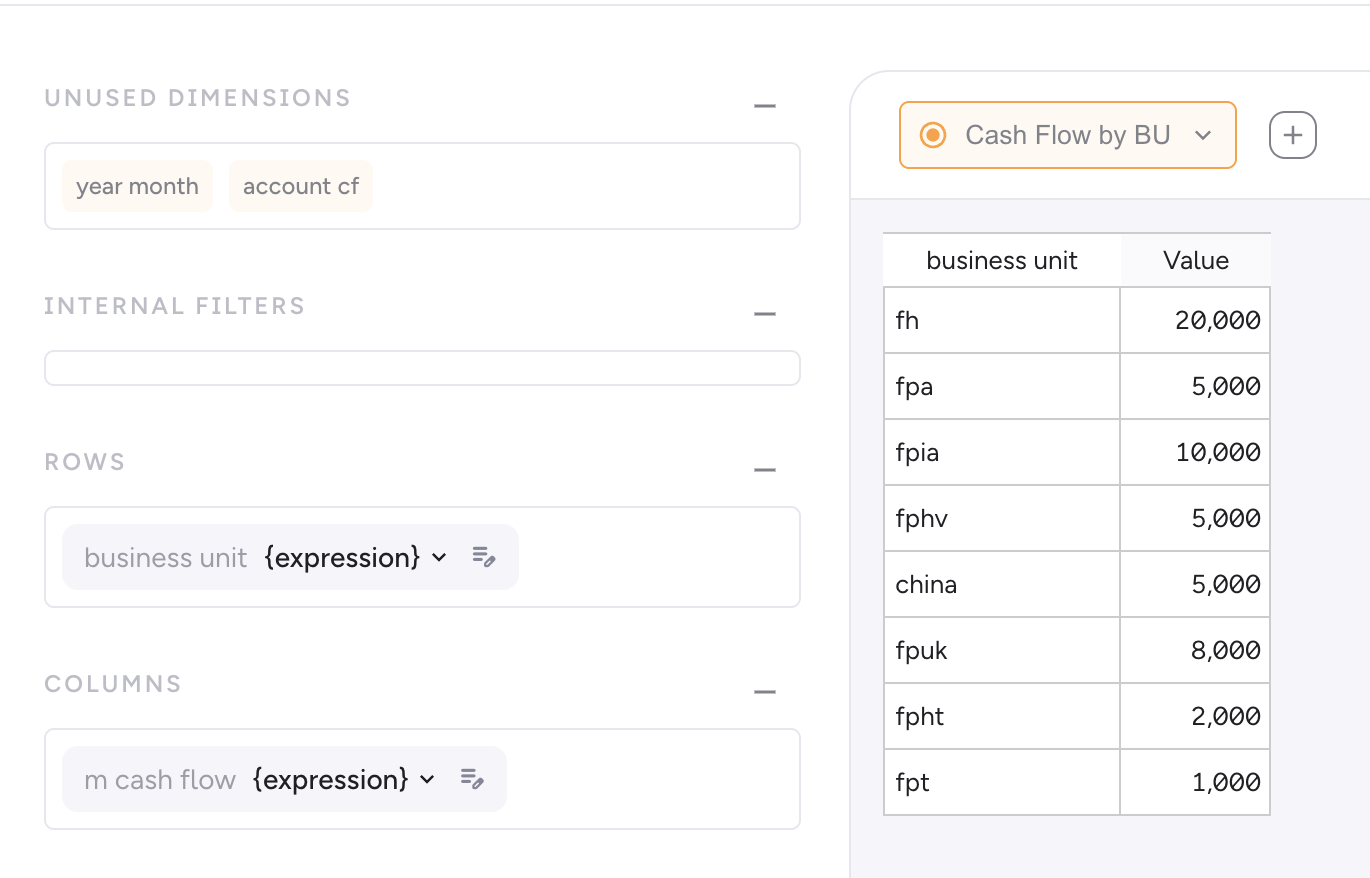
The datasource for the pie chart is defined below. However it is not showing the split of data by business unit. How do I map data for the pie chart to display correctly?