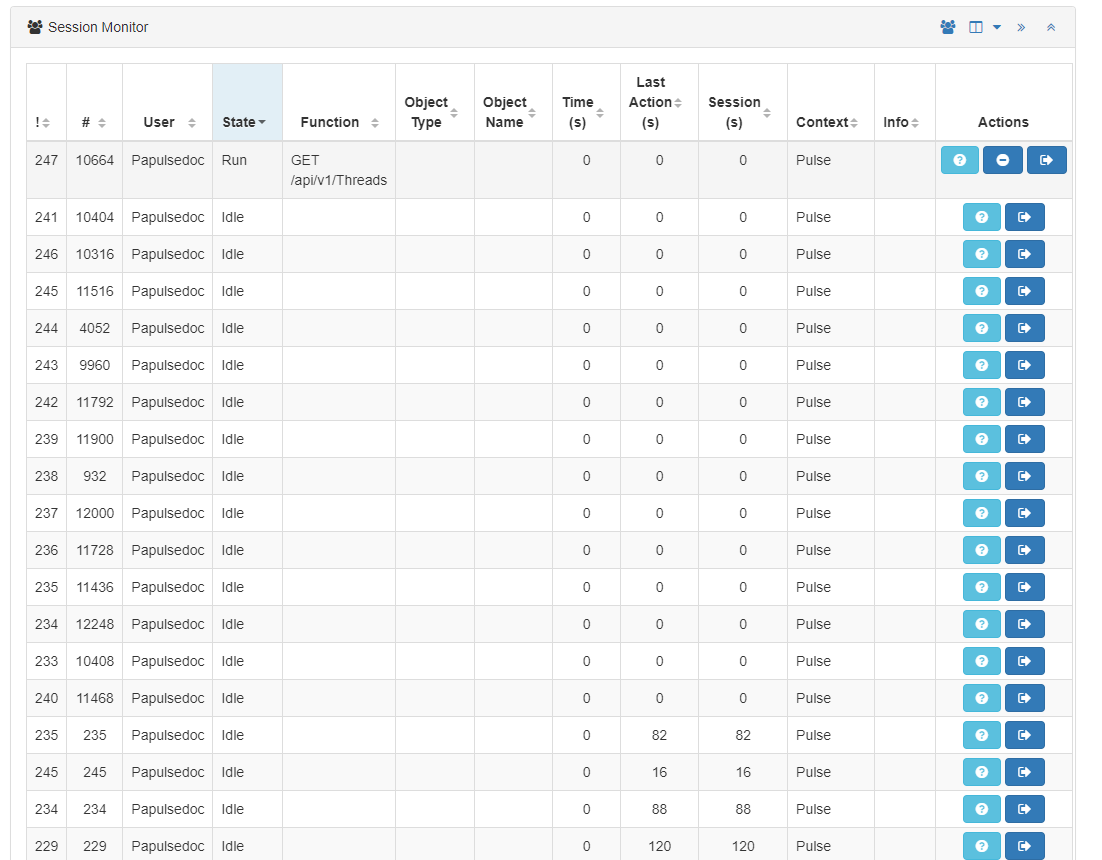
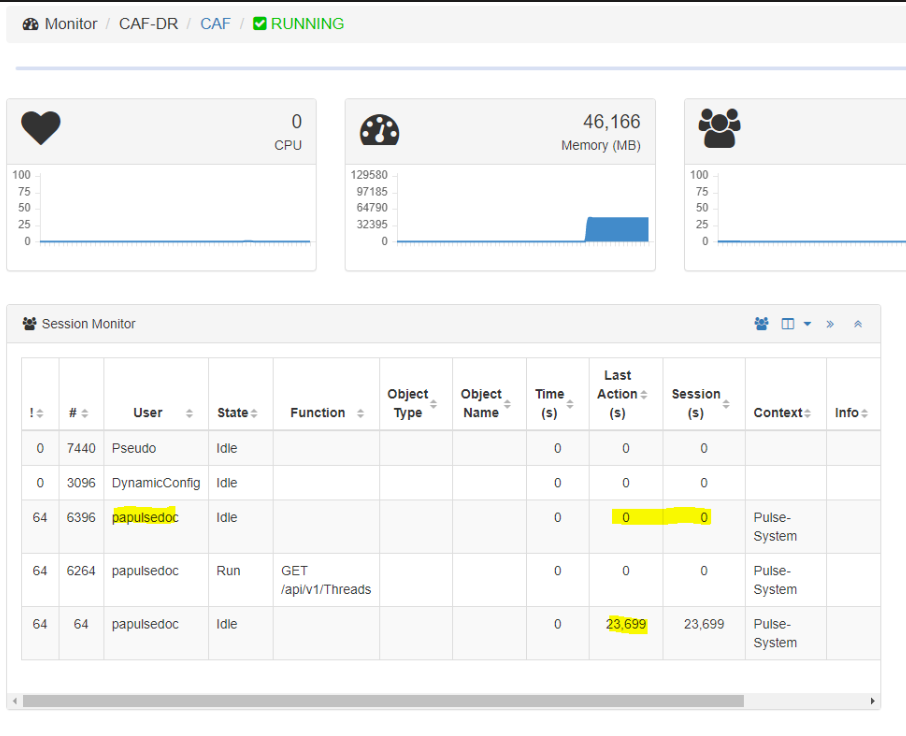
Please check the below snip. As you would be able to see there are multiple PAPULSEDOC login threads which are in inactive state.
PAPULSEDOC is the account that we use for Pulse to login into TM1, it has admin rights on the TM1 instances
Could you please advise on how to get rid of them?
Sessions and Threads management is something that is handled by TM1.
The above may not give the full story and we would advice to keep observing if it is a recurring scenario, or perhaps only during certain events like during start up for example? It will be worth checking as well if it is happening for other users.
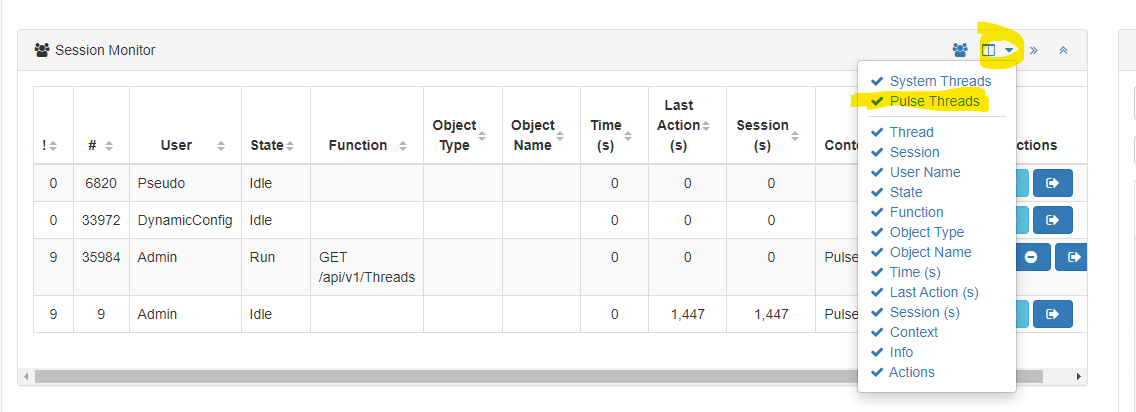
You can also manage or hide them via the following flag:
Thanks, I think that should be helpful in removing the idle threads.
But there’s always one thread of the same generic account that is in running state and even if we try to cancel the thread in actions, it won’t get cancelled. Why is this thread always running and is there any way to forcefully stop it if required?
Since it has caused some rollbacks in the instances.
In order to see the threads in the Pulse Live Monitor, Pulse needs to request the threads to TM1. This thread is when Pulse requests the threads to TM1 (by default it happens every second). It should be quick so you should not even see it.
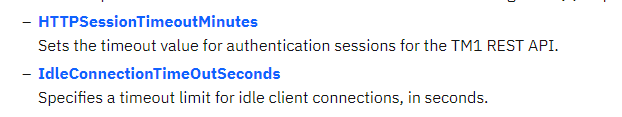
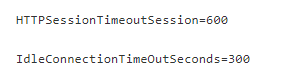
It is normal to have Idle threads in your sessions. If you want to reduce them you can use this setting HTTPSessionTimeoutMinutes, I think there is a typo in the one you used HTTPSessionTimeoutSession
Ok, will update it and check.
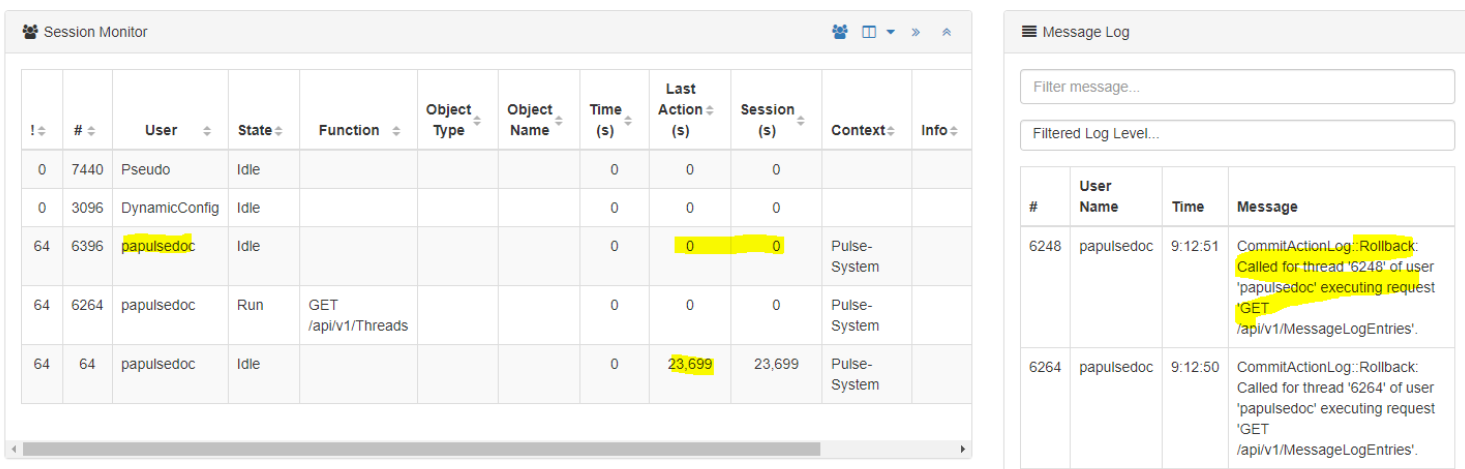
Now regrading the one thread that keeps on running, it sometimes randomly locks the processes causing rollbacks, Please refer the snips below.
This is a blocker for us in migrating Pulse v5.8.0 to v6.05/ v6.1
it sometimes randomly locks the processes causing rollbacks
Which process is being locked? Are there any actions that were done prior? Like are you trying to cancel the thread through another means for example?
The other scenario where we have seen that more often was with a TI process execution having issues halfway and is being aborted for example.
With regards to the MessageLogEntries, that is a query to retrieve data, not to update anything. So it could just be a TM1 data model session message only and is possibly related to the message logs not being able to be sent back to the requesting entity.
We have a Generic account “PAPULSEDOC” which is assigned to pulse in instance settings for documentations and monitoring. This generic account has admin access on TM1 instance.
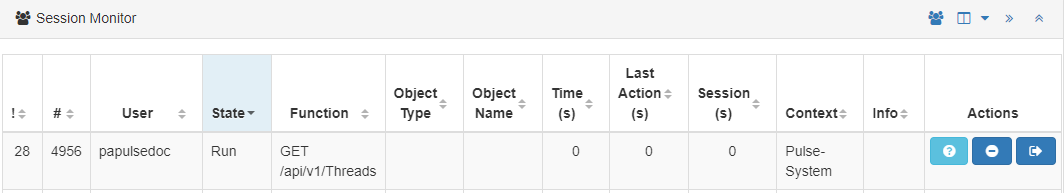
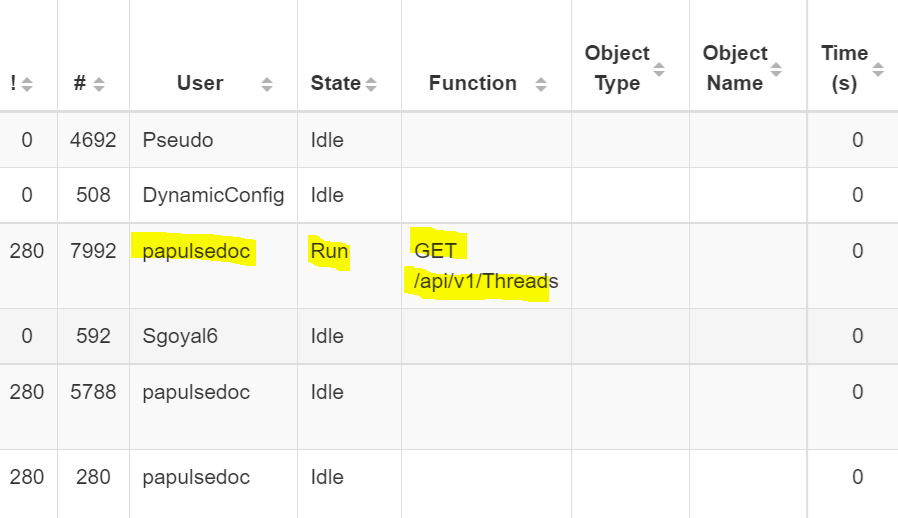
We have seen that this thread is continuously in run state - it is using API to get information from TM1 instance.
The issue that we are facing is - sometimes during long running TI process, the process gets rollback due to locking via PAPULSEDOC thread.
We need to identify how can we disable pulse thread to continously interfere into TM1 instance.
We have now many customers using Pulse 6 to monitor their production environments and no issues were reported regarding Pulse making another process to roll back.
I would go through the code of this specific process. There are a few things that you should avoid in a process to reduce the risk of rollback, for example having the securityrefresh function being executed in the Epilog of the process.
We recently updated to Pulse v6.1.0 on our DEV environment but still getting the same error. Thread is being rolled back.
As you can see from the below snip PAPULSEDOC thread is getting rolled back by another PAPULSEDOC thread:
We don’t want to have any active thread or we would at least like to have an option to stop the thread and prevent it from starting again or start/stop it as per our requirement.
Can you give more context as to what could potentially trigger the above events? Is someone else using the same account that Pulse is using? And what are they trying to do? Are they trying to run migration? Did they see something on the page during the Pulse package execution? To possibly further isolate the issue, if the Pulse account is being shared / used by another user, can you perhaps assign to Pulse an account that is solely going to be used by the itself?
As for that thread, that is a combination of Pulse querying TM1 every second and the state of the query at that time. The query itself usually takes a few milliseconds to complete. What Pulse is showing you in there is a snapshot of what it is a second ago.
In HTTP communications, 1000ms is a lot of time. The request above could have been completed in 100ms.
Changing the interval for that query is possible, though even if you change it to run every 5 seconds, you will still see that state as Run because that was the state of it 5 seconds ago, not because it ran for 5 seconds.