What is the correct syntax for changing the label format to a percentage?
"yAxis": [
  {
    "labels": {
      "enabled": true,
      "format": "{value}"
    }
  }
]
What is the correct syntax for changing the label format to a percentage?
"yAxis": [ { "labels": { "enabled": true, "format": "{value}" } } ]
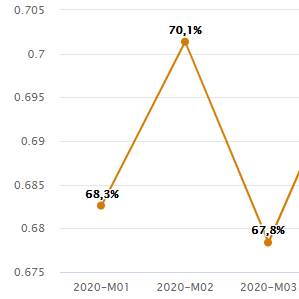
You could try “{value}%” as the parameter to “format” which would append the % symbol to the end. However, I assume you would also want to multiple it by 100 or otherwise it should show up as 0.68%. Not sure if there’s a way to do it without using “formatter” which hasn’t been support in Adv Options. You could multiple it by 100 in TM1 so it shows 68 but that would be a bit janky.
Funny you mentioned that Wei. I created a separate measure just for this reason, and I felt silly doing it. +1 to advanced formatter ![]()
Hi @Ulas,
Here is an example.
You can find it in the Apliqo Demo model, in the “Charts Advanced options” Dashboard
"chartOptions": {
    "chartsTooltipFormat": "%",
    "tooltip": {
      "shared": true
    },
    "plotOptions": {
      "series": {
        "dataLabels": {
          "format": "{point.percentage:,.2f}%",
          "enabled": true
        }
      }
    }
}Thanks, @rcantor. This only works for data label not for labels on the axis.
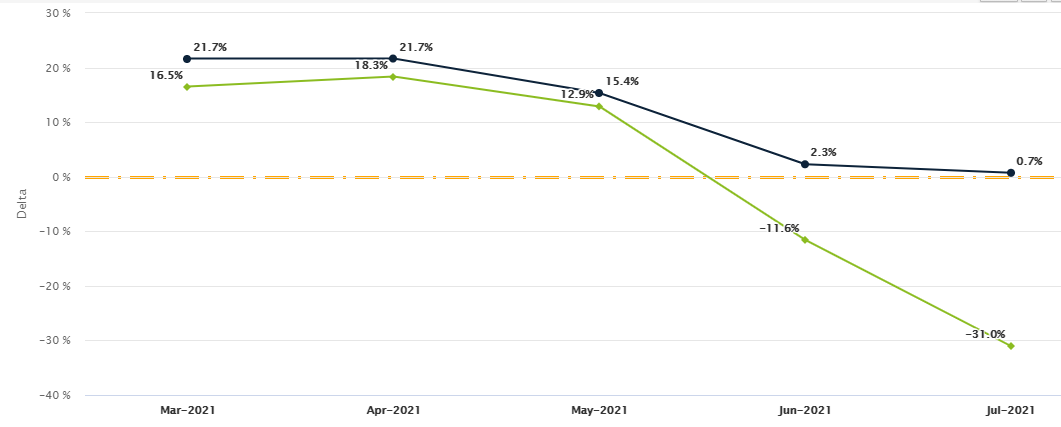
I applied the same approach as @wwang and @cyrus.rashedi.
This might help for axis labels and data labels…still can’t figure out how to get the tooltip formatted, but it’s workable for now.
  "chartOptions": {
"series": [
  {
    "color": "#0d233a",
    "fillOpacity": 0.1,
    "dataLabels": {
      "enabled": true,
      "align": "left",
      "format": "{point.y:.1f}%"
    }
  },
  {
    "color": "#8bbc21",
    "fillOpacity": 0.1,
    "dataLabels": {
      "enabled": true,
      "align": "right",
      "format": "{point.y:.1f}%"
    }
  }
],
"yAxis": [
  {
    "title": {
      "text": "Delta"
    },
    "labels": {
      "format": "{value} %"
    },
    "plotLines": [
      {
        "color": "orange",
        "width": 3,
        "value": 0,
        "dashStyle": "longdashdot"
      }
    ]
  }
]
}
Me neither. I disabled the tooltip for now so it does not confuse users.
Hey,
You can only format tooltips in Highcharts using the formatter: function() command.
Like so:
tooltip: {
	enabled: true,
	formatter: function() {
		this.series.name + ': ' + Highcharts.numberFormat(this.y, 0, ',');
	}
}
However, I don’t know if UX allows you to use formatter: function()
Jack