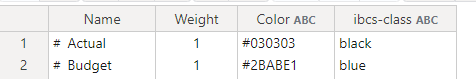
the ibcs classes only drive the column headers in the table component. The charts will pick up an attribute “Color” if set on the dimension.
1 Like
the ibcs classes only drive the column headers in the table component. The charts will pick up an attribute “Color” if set on the dimension.