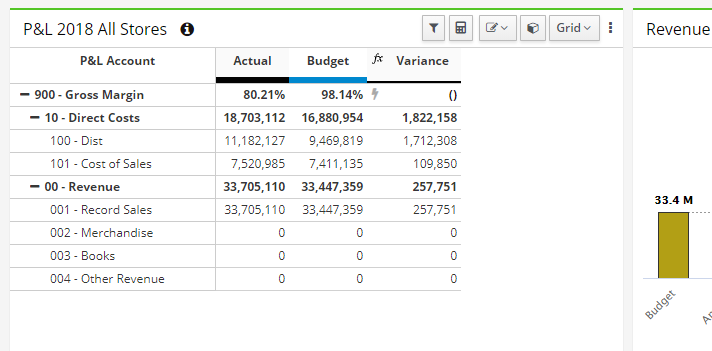
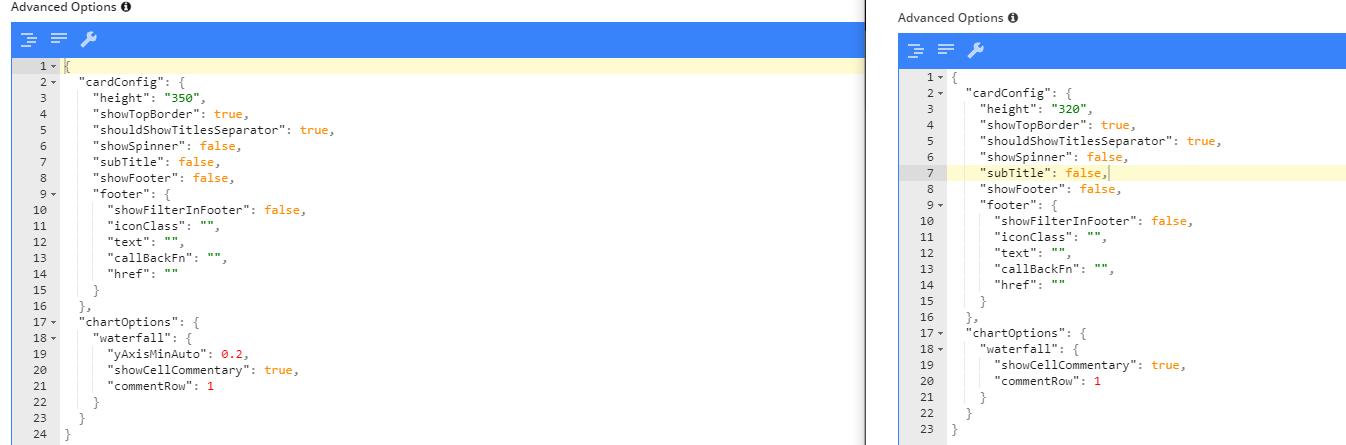
Hi, I am building a dashboard in UX, trying to use ibcsClass, it is setup using exact words as per the demo UX model, it works on the headers of my tables, but try what I may, I am not getting it to show on any of the charts I am using. Setup of the charts is the same as per the demo as well.
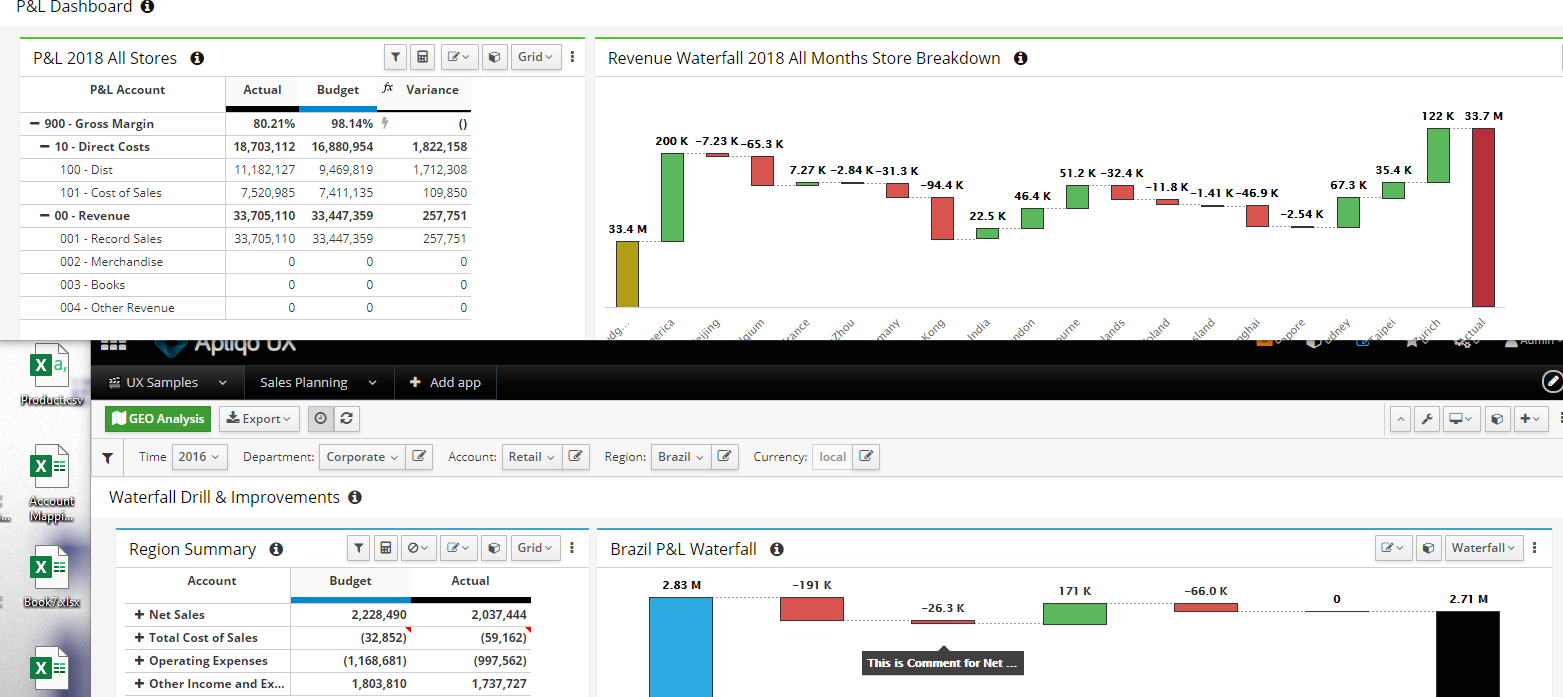
The chart will only pick up the color if the dimension is on rows. Is there a way to force the colors to be driven from the attribute no matter which axis the dimension is placed?
ps: I don’t want to hardcode it but similar to the table conditional formatting?
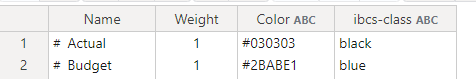
{“attribute”:“color”}