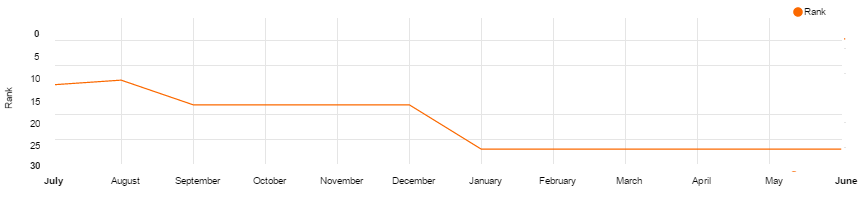
There is a simple canvas line chart which is showing a rank. The question is how to flip the Y-Axis to show 0 axis at the top rather than at the bottom.
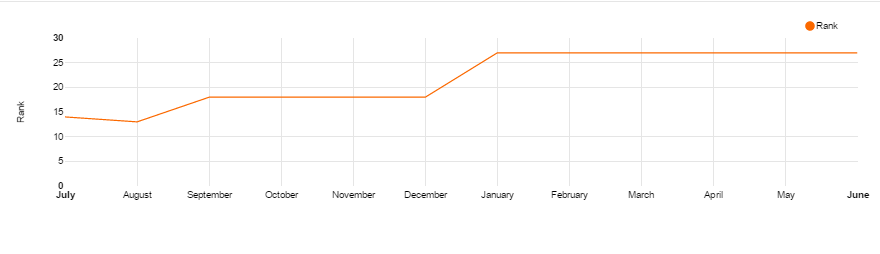
Is it any simple way to do this?
There is a simple canvas line chart which is showing a rank. The question is how to flip the Y-Axis to show 0 axis at the top rather than at the bottom.
Is it any simple way to do this?
Hi @eugene,
The property yDomain seems to be the one that you are looking for.
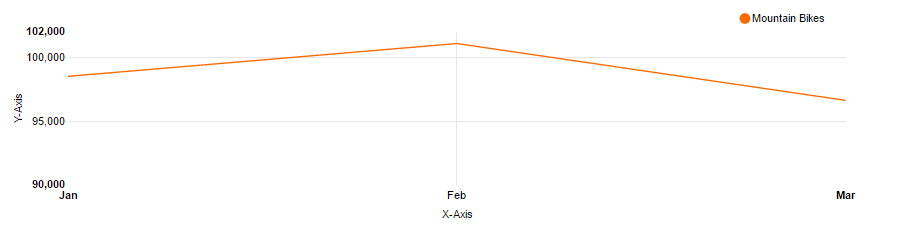
Below is how it looks like (note that ‘forceY’ property is for adjusting the minimum and maximum of the Y axis values displayed - nvd3 has many options you can configure that can affect your chart, just look them up, i.g. Google, Bing, etc.):
     <tm1-ui-chart tm1-chart-type="line" tm1-height="300" tm1-data-decimal="0" tm1-options-override="{chart:{forceY:[90000, 102000]}}">
        <tm1-ui-chart-dbr tm1-label="Jan" tm1-order-no="1" tm1-series="Mountain Bikes" tm1-instance="dev" tm1-cube="Retail" tm1-elements="1,2012,Jan,Local,1,Mountain Bikes,Sales Amount"></tm1-ui-chart-dbr>
        <tm1-ui-chart-dbr tm1-label="Feb" tm1-order-no="2" tm1-series="Mountain Bikes" tm1-instance="dev" tm1-cube="Retail" tm1-elements="1,2012,Feb,Local,1,Mountain Bikes,Sales Amount"></tm1-ui-chart-dbr>
        <tm1-ui-chart-dbr tm1-label="Mar" tm1-order-no="3" tm1-series="Mountain Bikes" tm1-instance="dev" tm1-cube="Retail" tm1-elements="1,2012,Mar,Local,1,Mountain Bikes,Sales Amount"></tm1-ui-chart-dbr>

      </tm1-ui-chart>
Producing:
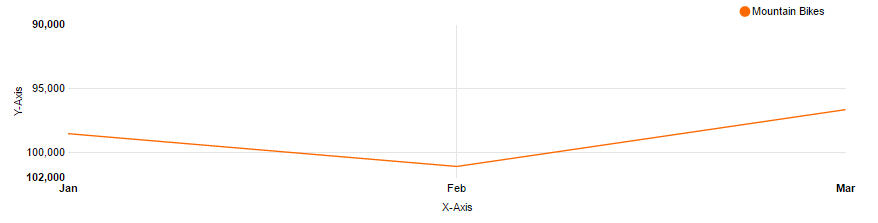
And with the yDomain, it now looks like:
    <tm1-ui-chart tm1-chart-type="line" tm1-height="300" tm1-data-decimal="0" tm1-options-override="{chart:{forceY:[90000, 102000], yDomain:[102000, 90000]}}">
        <tm1-ui-chart-dbr tm1-label="Jan" tm1-order-no="1" tm1-series="Mountain Bikes" tm1-instance="dev" tm1-cube="Retail" tm1-elements="1,2012,Jan,Local,1,Mountain Bikes,Sales Amount"></tm1-ui-chart-dbr>
        <tm1-ui-chart-dbr tm1-label="Feb" tm1-order-no="2" tm1-series="Mountain Bikes" tm1-instance="dev" tm1-cube="Retail" tm1-elements="1,2012,Feb,Local,1,Mountain Bikes,Sales Amount"></tm1-ui-chart-dbr>
        <tm1-ui-chart-dbr tm1-label="Mar" tm1-order-no="3" tm1-series="Mountain Bikes" tm1-instance="dev" tm1-cube="Retail" tm1-elements="1,2012,Mar,Local,1,Mountain Bikes,Sales Amount"></tm1-ui-chart-dbr>

</tm1-ui-chart>Cheers!
Paul
nice! I will try. does it mean I need to use $tm1Ui service to get data and sort array?
Hi @eugene,
I just copied from the samples and just updated the tm1-options-override. With the recent version that is out, you should probably do not need the tm1-order-no attribute already.
So just pull out data via the tm1-ui-chart-dbr and it should be able to give you what you need already without writing any JS script.
–
Paul
Yeh, I can get data from ng-model, but I need to sort it anyway, if I’m using tm1 as data source.
oh.
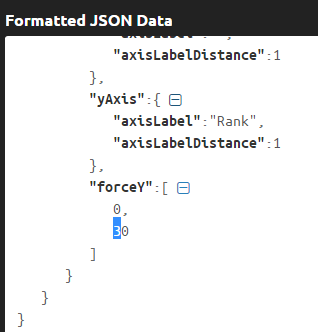
so I just need to use “domainY”:[30,1]
related question: how to force a chart refresh?
Hi @eugene,
Do you mean to just refresh the data?
Checkout the usage of tm1-state attribute of tm1-ui-chart.
As an example, if you want to update chart data on version change (stored in page.version), you do so like:
–
Paul
Hi @plim,
I will try this. I just want to flip axis in a more generic way by getting values from forceY and putting these values to domainY.