I am experiencing extremely high cpu and mem usage by canvas on medium size custom views when using tm1-ui-dbr as well as constant network pegging and bad input performance.
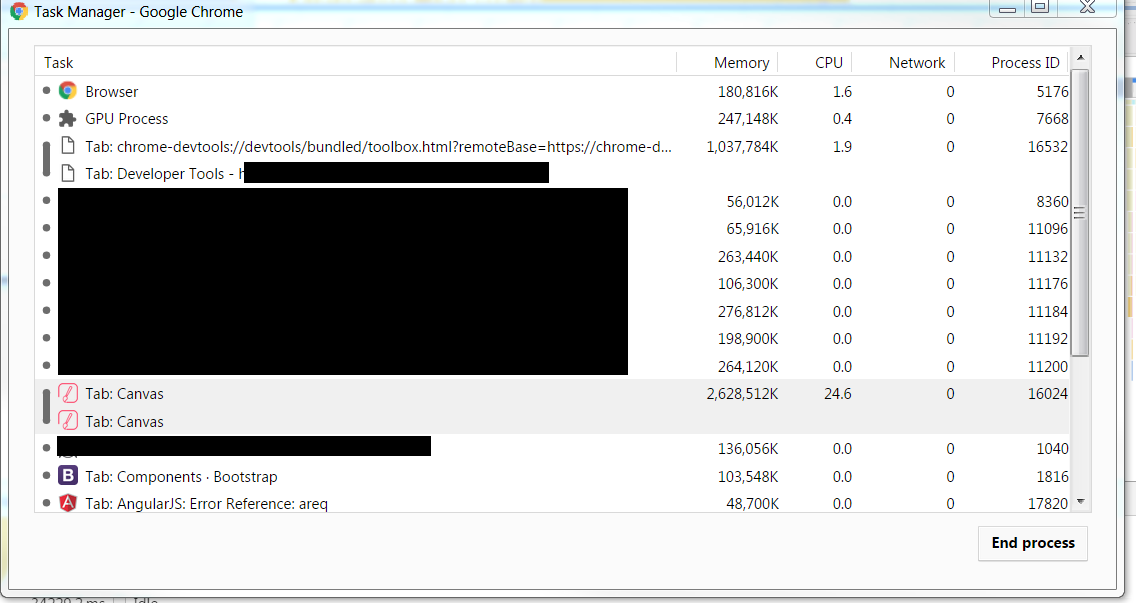
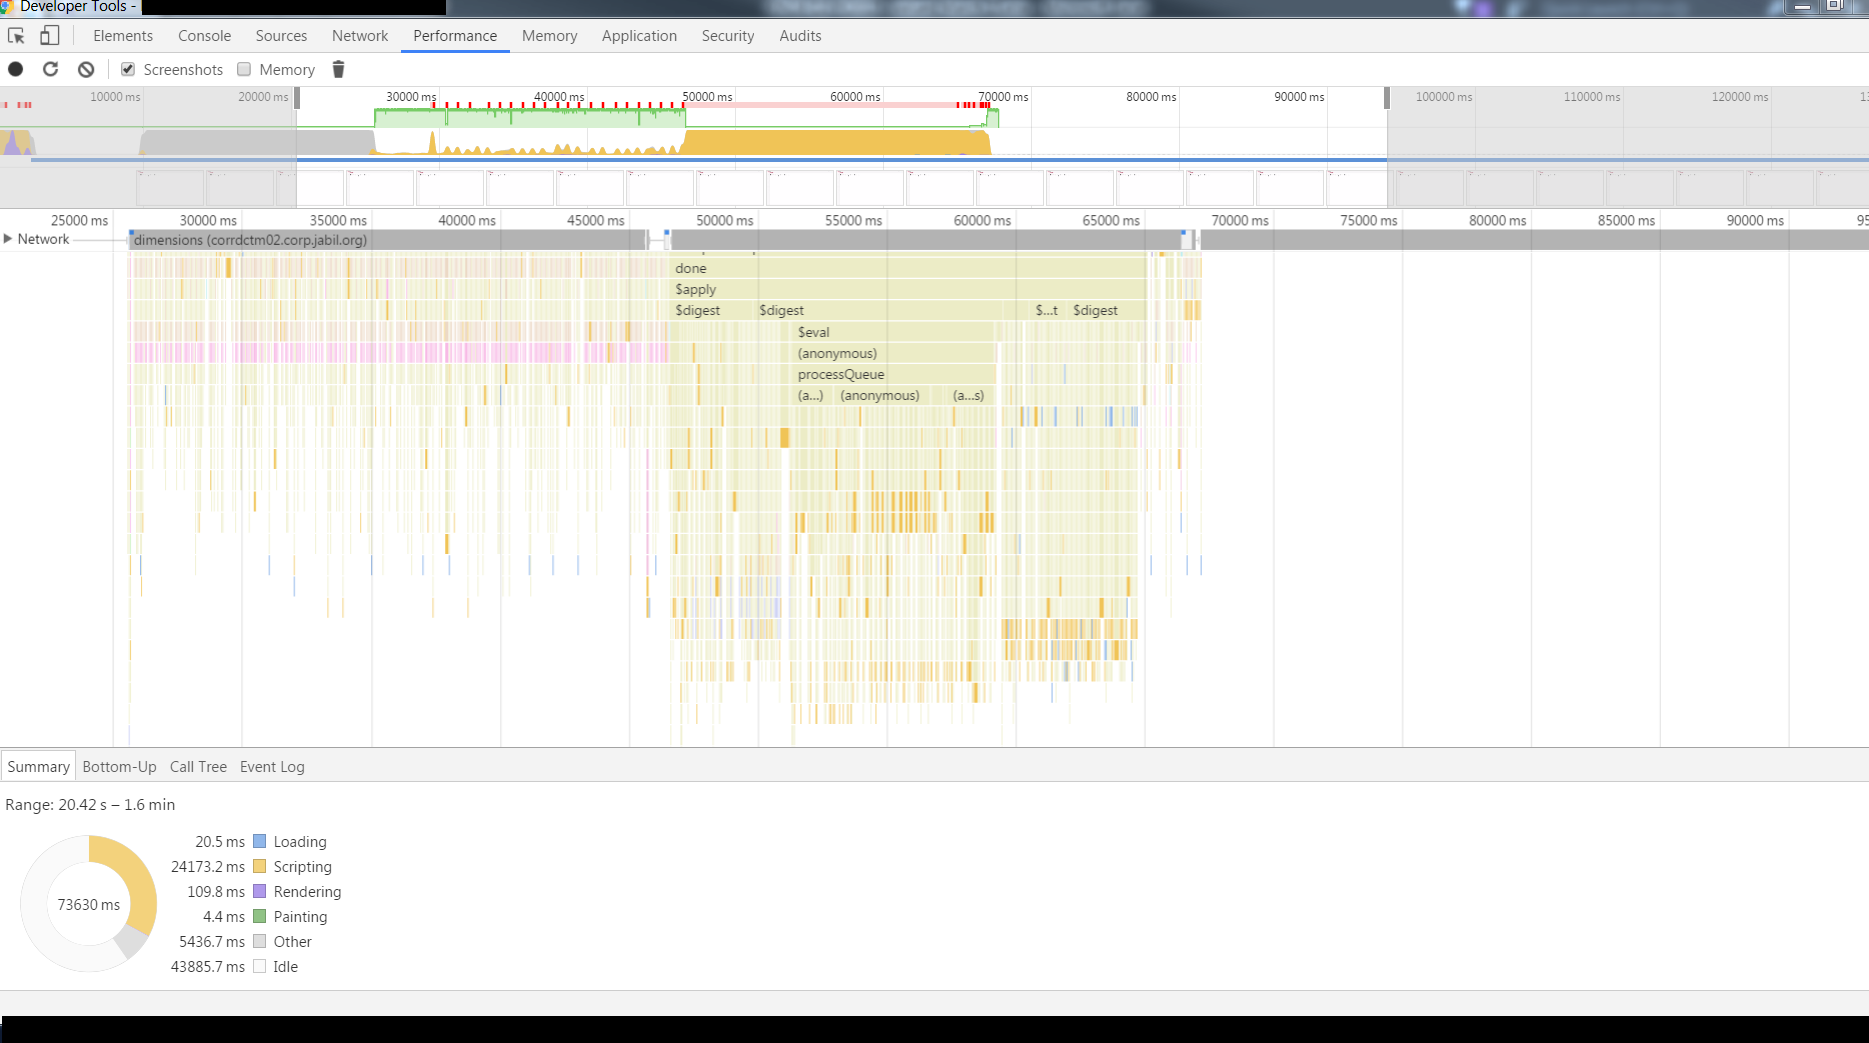
I have a simple table of 365 rows and 4 columns (+ 1 column for row labels) with each cell containing a tm1-ui-dbr. The dbrs are pulling from an attributes cube containing strings. This canvas page is using the > 2.6 Gb of ram and pegging my cpu at 25% ( maxing out the thread ) just when sitting there. The page seems to be triggering constant digest cycles with the tm1-ui-dbr when the page is loading and when it is idling. Furthermore inputting any kind of values into the input boxes is sluggish due to the performance hog when you have this many rows, because of the bad performance some inputs will not commit there values if you edit one input and quickly edit another, the first input will revert its value. Sometimes I am getting invalid cube name errors as well.
I am not getting these issues with the readonly dbr.
Can you provide some detail on how the DBRs are constructed? The triggering of the DBRs is based the either the cube name or the elements attribute changing. Are you using a repeat to pull out the contents and if yes what and how are you repeating over?
It’s a simply a ng-repeat over a tr on an array containing the elements of a dimension, in this case company codes, then in each tr I ng-repeat on a td over another array containing the elements of a measure dimension. In each td I have the dbr. This was a PoC page in order to test viability before I get into some dashboards with more complicated dimension arrangements and with queries across multiple cubes and varying formats.
Also Related:
The way I have tried to get around the performance issue is to dynamically load the cells as a user scrolls but this is not satisfactory. On the scroll event I debounce the test to see what cells I should render to fire only every 150ms, otherwise scroll performance is terrible due to browser repaints because I am measuring heights and such, but because the CPU is being pegged this 150ms timeout can take up multiple seconds to fire possibly due to the single thread available to javascript processing some other stack, perhaps another digest cycle.
An update on this issue, we have found a couple of bugs that were the cause of issues when there were a large number of DBRs on a page. We will be putting together a release shortly that everyone should upgrade to.