Hi,
I was wondering if there is a way to display memory consumption for a specific Cube in Kibana. We had the case where the overall memory consumption of the TM1 instance spiked and wanted to narrow down in which cube that spike occurred in Kibana.
I was unable to find this metric, but maybe I overlooked it.
Thanks - Guido
Hi Guido,
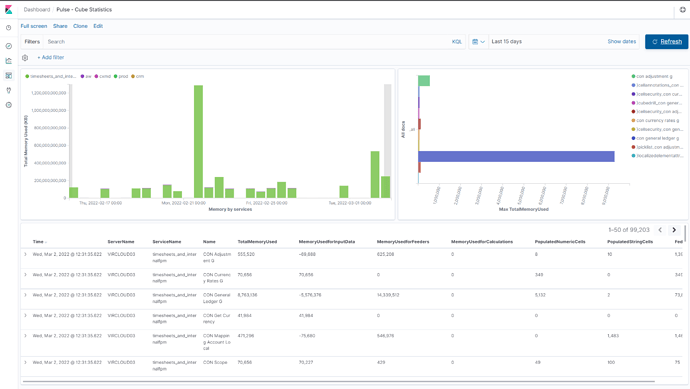
We currently don’t have a default dashboard to show the cube memory consumption. That is actually a good use case. So I created a new one called Pulse - Cube Statistic, you will see the cube stats by services and cubes:
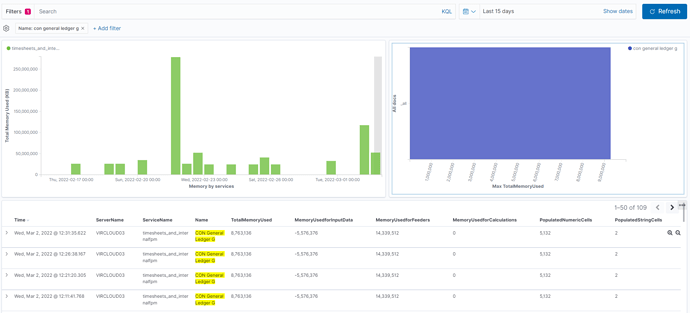
You can select a cube and see the memory:
To import this dashboard in your environment you will need to:
-
Download:
export-kibana-20220302.json (462.2 KB)
-
In Kibana you will need to go to Administration then Saved Object and click the import button:
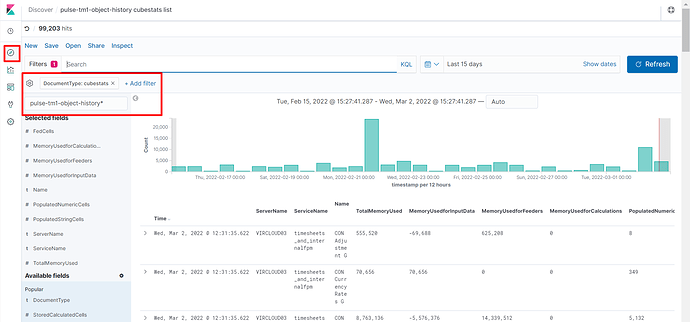
If you want to explore the Data, just go to Discover then select the index pulse-tm1-object-history and the DocumentType:cubestats:
Cheers,
Vincent
1 Like
Awesome Vincent, thanks for providing the dashboard. I’ll give it a try.
Cheers - Guido


