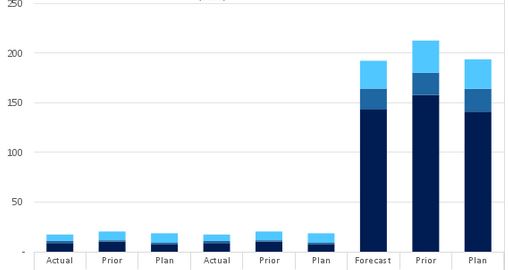
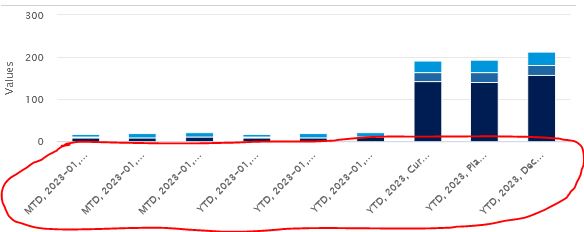
How can I modify the names as you can see in the 2 pictures? I want to have just 1 dimension and not all the 3 dimensions are in the columns.
Thanks
Hi @Filippo ,
If you always have the same number of columns on the chart, you can add a fixed text to each, by changing the xAxis categories.
on the Advanced settings, on the CODE… look for the “chartOptions”: {
Add the following code inside of it:
"xAxis": [
      {
        "categories": [
          "Actual",
          "Prior",
          "Plan",
          "Actual",
          "Prior",
          "Plan",
          "Forecast",
          "Prior",
          "Plan"
        ]
      }
    ],
Thanks Rodrigo but for some reason it is not working, column are fixed however 3 of them are hidden.
I have tried your code and the below but still no luck:
{
“table”: {
“colWidths”: [
86,
112,
49,
108,
0,
0,
0,
102,
49,
92,
102,
49,
92
],
“hiddenColumns”: [
4,
5,
6
],
“hiddenRows”: [],
“tableFilters”: {
“conditionsStack”: []
},
“insertedRowsAndColumns”: {
“columnDataIndex”: 0,
“rowDataIndex”: 0,
“columnData”: [],
“rowData”: []
},
“columnsMap”: [
0,
1,
2,
3,
4,
5,
6,
7,
8,
9,
10,
11
],
“rowsMap”: [
0,
1,
2
],
“rowFormat”: {
“”: [
{
“readOnly”: false,
“className”: “hide-column-header”
}
]
}
},
“chartOptions”: {
“xAxis”: [
{
“categories”: [
“Actual”,
“Prior”,
“Plan”,
“”,
“”,
“”,
“Actual”,
“Prior”,
“Plan”,
“Forecast”,
“Prior”,
“Plan”
]
}
],
“series”: [
{
“type”: “column”,
“color”: “#0096DB”
},
{
“type”: “column”,
“color”: “#1F67A2”
},
{
“type”: “column”,
“color”: “#001D53”
}
],
“plotOptions”: {
“series”: {
“dataLabels”: {
“enabled”: false
}
},
“column”: {
“stacking”: “normal”,
“dataLabels”: {
“enabled”: false
}
}
}
}
}
Hi @Filippo ,
the categories are only for the displayed data, that you are plotting on the chart, you don’t need to add the blank “” for the hidden ones.
Hi @rmazziero , unfortunately either way this is not working.
Maybe some issue in the syntax?
{
  "table": {
    "colWidths": [
      86,
      112,
      49,
      108,
      0,
      0,
      0,
      102,
      49,
      92,
      102,
      49,
      92
    ],
    "hiddenColumns": [
      4,
      5,
      6
    ],
    "hiddenRows": [],
    "tableFilters": {
      "conditionsStack": []
    },
    "insertedRowsAndColumns": {
      "columnDataIndex": 0,
      "rowDataIndex": 0,
      "columnData": [],
      "rowData": []
    },
    "columnsMap": [
      0,
      1,
      2,
      3,
      4,
      5,
      6,
      7,
      8,
      9,
      10,
      11
    ],
    "rowsMap": [
      0,
      1,
      2
    ],
    "rowFormat": {
      "": [
        {
          "readOnly": false,
          "className": "hide-column-header"
        }
      ]
    }
  },
  "chartOptions": {
    "xAxis": [
      {
        "categories": [
          "Actual",
          "Prior",
          "Plan",
          "Actual",
          "Prior",
          "Plan",
          "Forecast",
          "Prior",
          "Plan"
        ]
      }
    ],
    "series": [
      {
        "type": "column",
        "color": "#0096DB"
      },
      {
        "type": "column",
        "color": "#1F67A2"
      },
      {
        "type": "column",
        "color": "#001D53"
      }
    ],
    "plotOptions": {
      "series": {
        "dataLabels": {
          "enabled": false
        }
      },
      "column": {
        "stacking": "normal",
        "dataLabels": {
          "enabled": false
        }
      }
    }
  }
}
Hi @Filippo ,
your code seems correct, but for some reason the issue might be the [].
Try like the code below, with the {} instead, and adding the “type” as well:
"xAxis": {
    "type":"category"
    ,"categories": [
      "Actual",
      "Prior",
      "Plan",
      "Actual",
      "Prior",
      "Plan",
      "Forecast",
      "Prior",
      "Plan"
    ]
  }
,
This should work!