We are holding colour codes in an attribute against some elements in a dimension. We are using ng-repeat in a chart for these elements, my question is how can we retrieve the colour attribute, turn it into an array, and then feed it into the chart?
I can get a list of elements including the attribute using tm1-ui-element-list or $tm1Ui.dimensionElements, but don’t yet possess the technical prowess to isolate the attribute and turn it into an array. Any suggestions?
To understand better how to update chart colors in Canvas, I would recommend to check first this Help article:
There are two ways to update the colors based on TM1 attribute values:
Option 1: Create an array and use it in the tm1-color-scheme parameter of the tm1-ui-chart: tm1-color-scheme=‘[“#009900”, “#00b300”, “#00cc00”, “#00e600”, “#00ff00”]’:
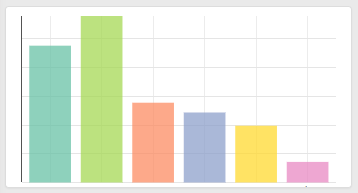
Option 2:Get the attribute using a tm1-ui-element-list and use the tm1-color parameter of the tm1-ui-chart-dbr to add the color to each element.
I prefer option 2 because I think it’s quicker and you avoid writing to much JavaScript:
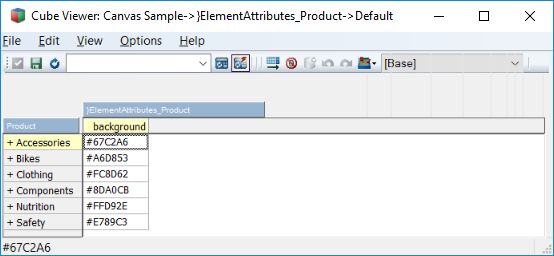
Create attribute in TM1
Create the list using tm1-ui-element-list and get the attribute background using tm1-attributes:
I have been able to get some data by using the following:
$tm1Ui.cubeExecuteMdx ('veolia','SELECT {[}ElementAttributes_WAS Route].[Color]} ON 0, {FILTER( {[WAS Route].[Total Commodity].CHILDREN}, [WAS Route Profitability].([WAS Version].[ACT],[T Date].[{{selections.period}}],[FIN Cost Center].[Total FIN Cost Center],[WAS Plant].[{{selections.plant}}],[WAS Service Area].[{{selections.serviceArea}}],[WAS Driver Type].[Total WAS Driver Type],[WAS Equipment].[Total WAS Equipment],[WAS Driver].[Total WAS Driver],[WAS Route Profitability M].[Statistical],[Time Analysis].[BASE],[Scale].[BASE]) <> 0 )} ON 1 FROM [}ElementAttributes_WAS Route]').then(function(data){
    $scope.chartColors = data.Cells;
});
When I look at the results on the HTML page (by just listing {{chartColors}}) I see this:
[{“Value”:"#663300"},{“Value”:"#009933"},{“Value”:"#ffff99"},{“Value”:"#ffff00"},{“Value”:"#ff6600"},{“Value”:"#0099ff"}]
These are the values I need, but when I insert tm1-color-scheme="{{chartColors}}" into the tm1-ui-chart directive the chart no longer displays. I’m guessing I need to further modify this array so it holds only the colour codes without the {“Value”?
You are on the right direction already with the above! The extra step that you would just have to do is to convert it into an array of Strings. Above is an array of Objects.
The idea is to create an array which will only contain strings as needed by the tm1-ui-chart.
There are a number of ways that you can go about it. To give an example, we will use a library that is within Canvas called Lodash. And this is how you can convert the above result to an array of string:
$scope.chartColors = []; // this is to initialize our array

// below is a utility function which lets you iterate over an array regardless of the type within, i.e. text, object, number
_.forEach(data.Cells, function(cell){
  $scope.chartColors.push(cell.Value); // this is to insert the color property as string into our array
});
And lastly, note that the attribute tm1-color-schemeis not being watched. So on your HTML page, the tm1-ui-chart should only be initialized when the $scope.chartColors is populated. To do that, one way is to utilize ng-if on your page like so:
I’ve now got the colours into an array, showing “{{chartColors}}” on the html page returns ["#663300","#009933","#ffff99","#ffff00","#ff6600","#0099ff"], however, when updating the chart directive as follows the chart still doesn’t render:
I’ve tried various different ways of updating the color scheme command: ‘{{chartColors}}’, “{{chartColors}}”, {{chartColors}}, none of them work. Am I doing something wrong?