Hi all;
I’m creating a very simple Line with focus chart where the X-Axis is a continuous time dimensions “YearMonth”.
I also have a Subnm in the page which is populated by a “Year” dimension.
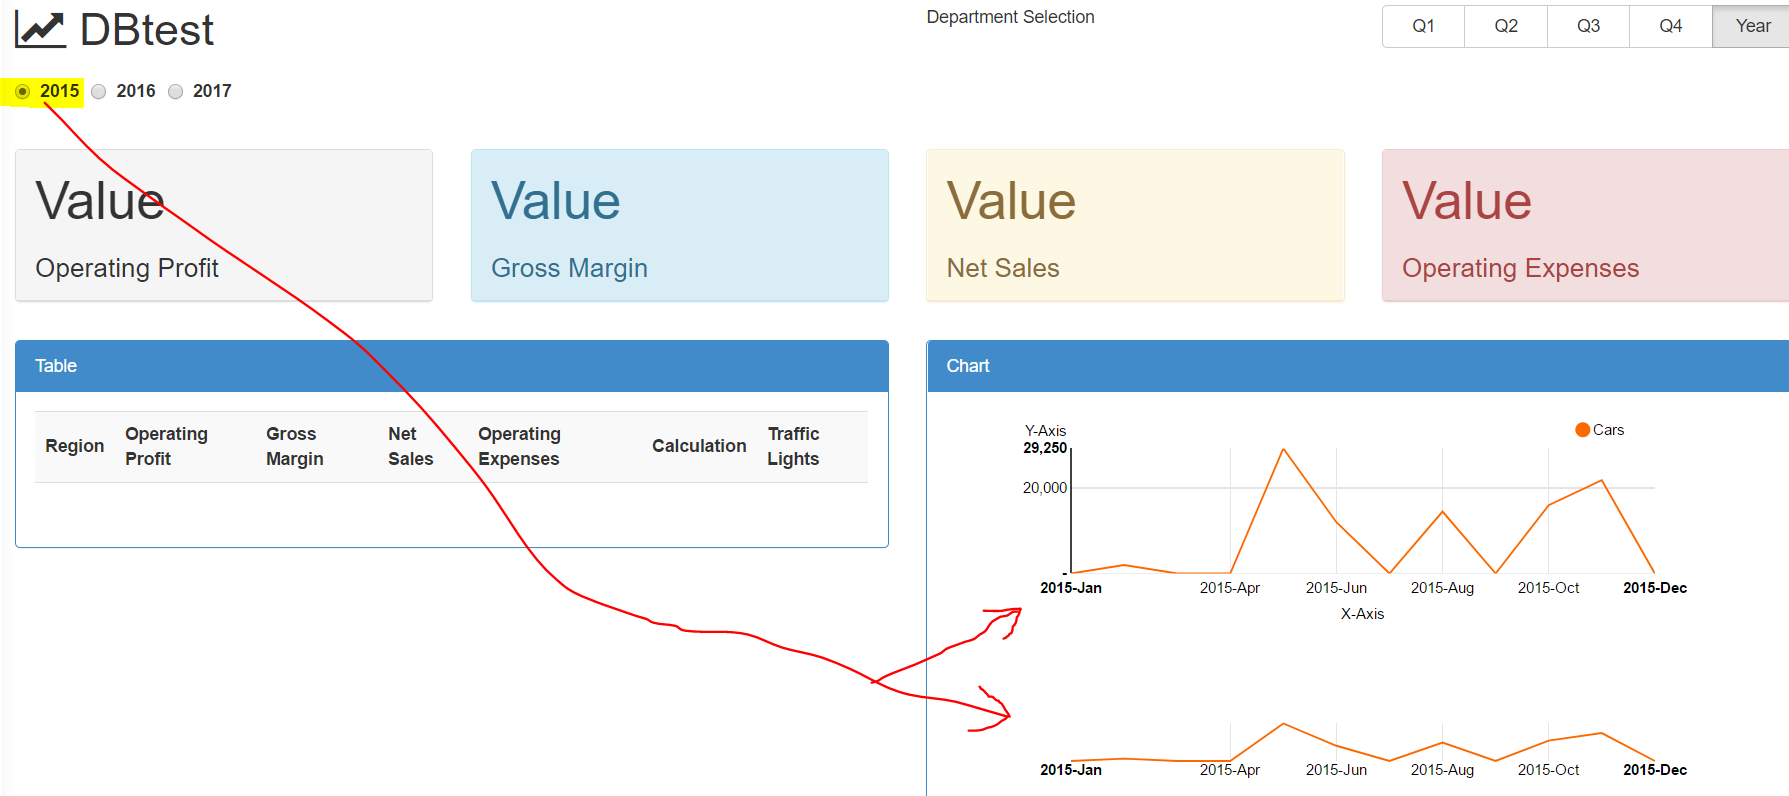
When the page loads for the first time, the corresponding 12x months from the YearMonth dimension are shown in the X-Axis of the chart.
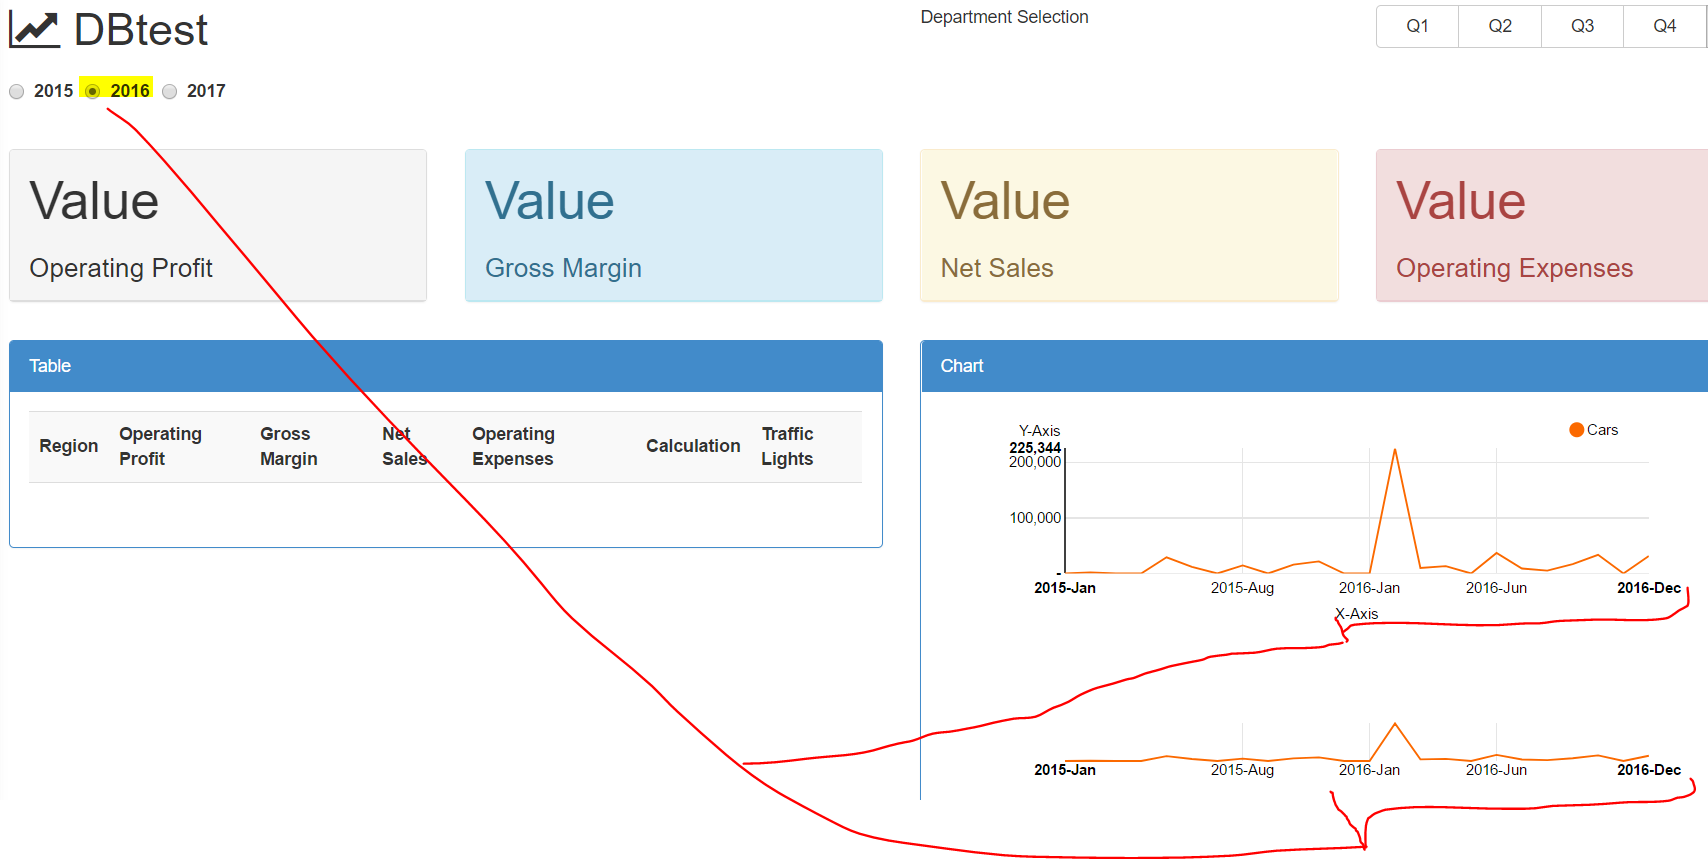
However, when changing the the Subnm Year selection, say from 2015 to 2016, there are now 24x months from the YearMonth dimension shown in the X-Axis of the chart.
I want to dynamically show only 12x months for the selected year. This is the code:
    <div class="col-md-3">
      <tm1-ui-subnm tm1-instance="sales" tm1-dimension="Year" tm1-subset="Canvas_Titles" tm1-radio-only="horizontal" ng-model="page.title.Year"></tm1-ui-subnm>
    </div>

            <tm1-ui-chart tm1-chart-type="lineWithFocus" tm1-height="300" tm1-margin="chart.margin" tm1-data-decimal="0" ng-model="page.data">

                <tm1-ui-chart-dbr
                  ng-repeat="yearmonth in [page.title.Year +'-Jan',page.title.Year +'-Feb',page.title.Year +'-Mar',page.title.Year +'-Apr',page.title.Year +'-May',page.title.Year +'-Jun',page.title.Year +'-Jul',page.title.Year +'-Aug',page.title.Year +'-Sep',page.title.Year +'-Oct',page.title.Year +'-Nov',page.title.Year +'-Dec']"
                  tm1-label="{{yearmonth}}"
                  tm1-series="Cars"
                  tm1-instance="sales"
                  tm1-cube="Sales Opportunity"
                  tm1-elements='"United Kingdom","GBP Reporting",{{yearmonth}},"All Sales Owners","All Lead Sources","All Types","All Stages","All Customers","All Opportunities","Pulse","Total Revenue"'
                ></tm1-ui-chart-dbr>
<
