I want compares rankings of my organizations for two periods in a dashboard. Organizations will be ranked according their performance for each period. In the end I want to show the change in rankings compared to a reference period (e.g. previous month, previous quarter, previous year, etc.).
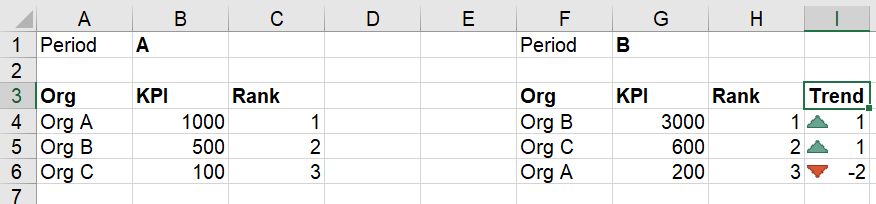
E.g. an organization A is ranked on first position in period A but only on 3rd position in period B. So the organization lost 2 positions compared to the previous period. I want to show this change of positions. The result could look like this:
The ranking is not available in TM1, therefore I need to calculate it using formulas in the dashboard.
Is there a formula available, that I can use to calculte the organization’s rank per period? From what I see, there is no rank formula available.
Or is there another way, how I can achieve this comparison?
With 2 widgets you can do the ordering for the ranking quite easily with MDX using the ORDER function. You could either disply the rank easily with a custom function in UX just incrementing +1 from the row above or a bit more tricky using With Member As and the MDX RANK function.
I would use the RANK function as this is going to be necessary to show the variance or movement in rank between periods as there is no way to do this with a custom UX formula as you can only reference cells within a widget and not between 2 independent widgets. This is possible with pure MDX by using With Member As Rank(p1) - Rank(p0) but it is going to be complicated!
The verdict: it’s possible but the MDX will get a little tricky. Alternatively you could run a TI process and hardcode the ranks per period to a reporting cube. Then it is going to be much easier to report on.
Note for the 2nd widget you’re going to need to use the full MDX option.
Here’s some examples of using the Rank function which are a bit better than what the Microsoft documentation gives you.