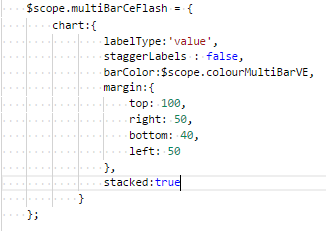
I am testing creating a stacked MultiBar Chart, but not succeeding in getting the chart to stack.
it just stays as a normal multiBar.
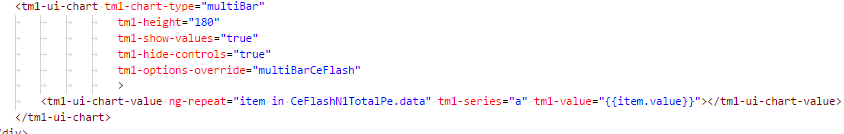
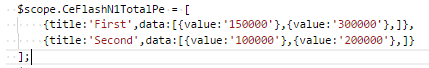
I suspect I am either usinig the ‘tm1-ui-chart-value’ directive incorrectly, or maybe there is a problem in the way the tm1-value object variable, CeFlashN1TotalPe, is declared.
Not just another tm1-ui-chart-value formula, but another set/series of data.
For example, if you have values in the multi bar chart as series A:
100, 200, 500
Then, you should have another series that is let us say, series B, that has:
200, 300, 100
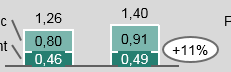
The multi bar, will “pair” 100 and 200 from series A and B, and will do so for the rest. These are what the multi bar chart is stacking up (100 over 200, 200 over 300, 500 over 100).
Thanks for explaining - i managed to get it working now.
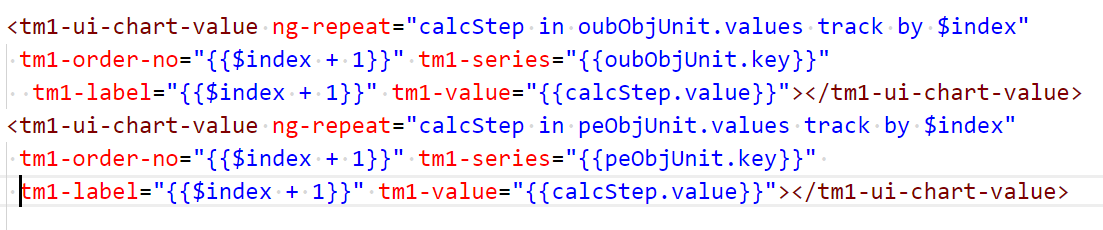
I created a new simplified tm1-value-object and adjusted the tm1-ui-chart-value directives itself also: