Hi,
I have the following chart:
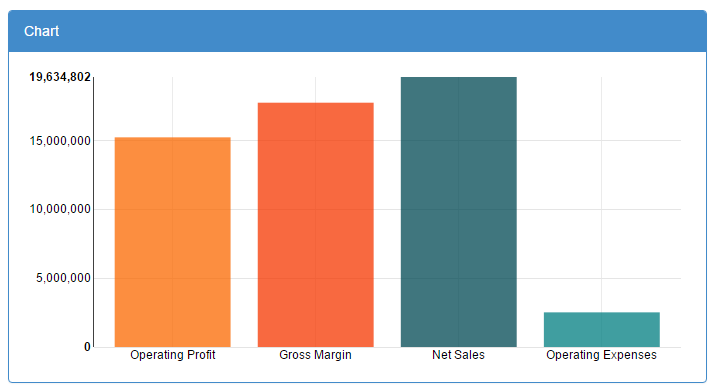
On the Y axis, instead of showing 15,000,000. I’d like to see 15.0.
Can I do this in Canvas or should I use an other measure in TM1?
here my code:
 <tm1-ui-chart
                     tm1-chart-type="discreteBar"
                     tm1-height="300"
                     tm1-axis-label-x=""
                     tm1-axis-label-y=""
                     tm1-data-decimal="0"
                     tm1-duration="2000"
                     tm1-margin="{top: 10, right: 10, bottom: 20, left: 70}"
                     >

                  <tm1-ui-chart-dbr
                     tm1-label="Operating Profit"
                     tm1-instance="dev"
                     tm1-cube="General Ledger"
                     tm1-elements='"Actual","2015/16",{{page.titles.month}},"Local","Total Europe",{{page.titles.Department}},"Operating Profit","Amount"'>
                  </tm1-ui-chart-dbr>

                  <tm1-ui-chart-dbr
                     tm1-label="Gross Margin"
                     tm1-instance="dev"
                     tm1-cube="General Ledger"
                     tm1-elements='"Actual","2015/16",{{page.titles.month}},"Local","Total Europe",{{page.titles.Department}},"Gross Margin","Amount"'>
                  </tm1-ui-chart-dbr>

                  <tm1-ui-chart-dbr
                     tm1-label="Net Sales"
                     tm1-instance="dev"
                     tm1-cube="General Ledger"
                     tm1-elements='"Actual","2015/16",{{page.titles.month}},"Local","Total Europe",{{page.titles.Department}},"Net Sales","Amount"'>
                  </tm1-ui-chart-dbr>

                  <tm1-ui-chart-dbr
                     tm1-label="Operating Expenses"
                     tm1-instance="dev"
                     tm1-cube="General Ledger"
                     tm1-elements='"Actual","2015/16",{{page.titles.month}},"Local","Total Europe",{{page.titles.Department}},"Operating Expenses","Amount"'>
                  </tm1-ui-chart-dbr>

</tm1-ui-chart>
Cheers,