Importing D3 charts into Canvas

Is there an tutorial on how to import new D3 charts into canvas.

For example

https://www.linkedin.com/pulse/custom-treemap-directive-poshak-maheshwari

I have include the javascript file and css files in the header, I just not sure how I get the component to work.

HTML code is


$scope.componentData is being defined in the controller.

The example has the treemap defined in the module see below.

var app = angular.module('exampleApp',['treemap']);

Brian

Hi Brian,

You need to add the module to index.ftl like so:

  1. Find: var customAngularModules = [];
  2. Add your module: var customAngularModules = ['treemap'];
  3. Save the file and refresh your page.

Hi @bknott,

Note that the D3 library is already included within Canvas.

The above is an Angular library built on top of a d3 chart.

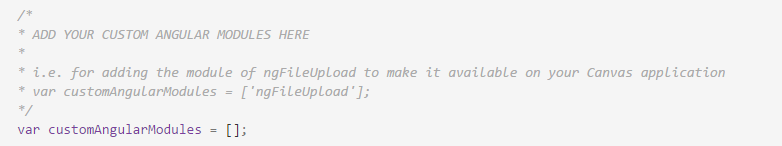
And regarding the last line about adding an angular module, you should be able to add that via the index.ftl file. There is a section in there that looks like below:

Also do take note that the version of d3 that we have in Canvas is 3.5.17.


Paul

@tryan I did try adding it as a custom module but I get the error below

Error: [$injector:strictdi] function($compile) is not using explicit annotation and cannot be invoked in strict mode

Hi Brian,

There are references out there on web that explain the issue. If you look at the source of the directive you will see function($complie), it should be function(['$complie', function($compile) ...