Hi Team
Is it possible to setup collapse/hide options on rows similar to the “Group” option in Excel?
Please let me know if I can provide any additional details that might be helpful.
Thanks,
Zach
Hi Team
Is it possible to setup collapse/hide options on rows similar to the “Group” option in Excel?
Please let me know if I can provide any additional details that might be helpful.
Thanks,
Zach
Hi,
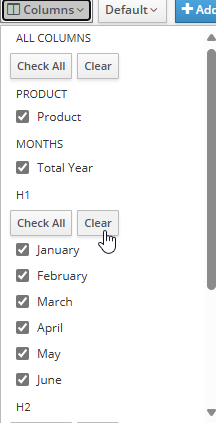
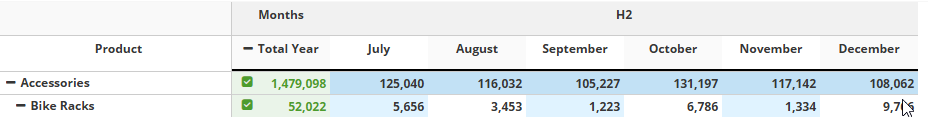
Yes this is possible as an OOTB feature for columns as long as the report is a view and not a dashboard. However, I would assume this should be OK as this option makes more sense in the context of a view where a single spreadsheet like table grid takes up the entire page.
Now I know that you asked the question about rows. However, to me this doesn’t really make any sense at all since the default behaviour is always to have collapsable/expandable rows and this happens automatically via the hierarchy rollup structure. In Apliqo we allow this to be disabled, but it is always enabled by default. This is simply how it works. Therefore I answered how this would be done for columns. For rows the answer is simply “via the dimension structure.”
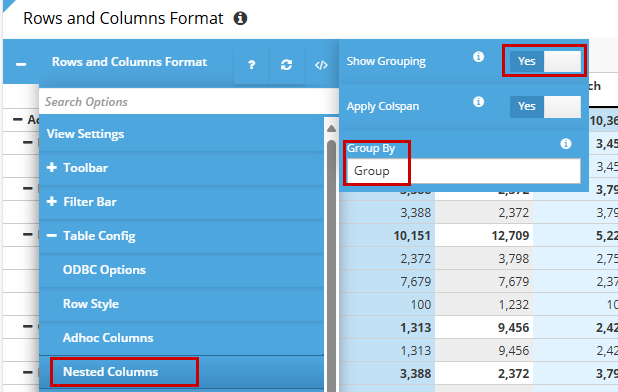
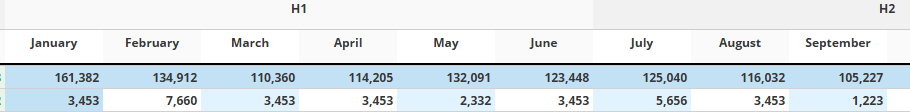
We don’t really have a specific example of this in the demo application, but you could look at UX Samples > Formatting Examples > Rows and Columns Format (a16.f1.v2). By default the way this works is that the values of an attribute on the column dimension are used the create the grouping. The default attribute name if omitted is “Group”.
The mechanism in the GUI isn’t the same as for Excel grouping but it achieves the same result.
Note that the grouping itself (with double column header display) also works exactly the same for grid widgets in a dashboard, but there is no mechanism to show/hide columns per group, this is only provided for views.