Hi All,
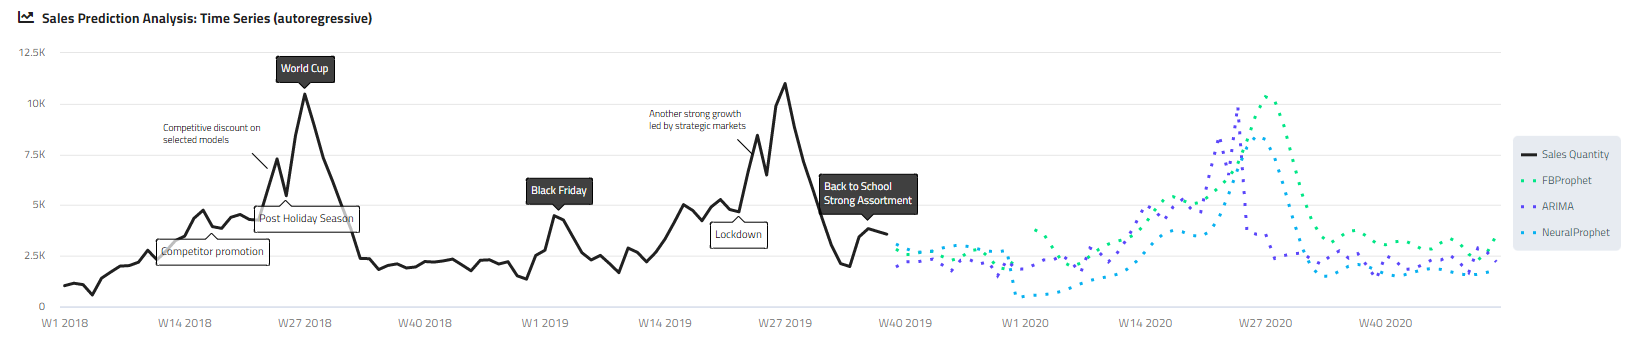
I’d like to display cell annotations in a chart but currently, I couldn’t find a way to dynamically manage them.
I am guessing I need to open an ER but is there a better workaround to achieve this?
"annotations": [
  {
    "draggable": "",
    "labelOptions": {
      "backgroundColor": "rgba(255,255,255,0.7)",
      "verticalAlign": "top",
      "y": 15
    },
    "labels": [
      {
        "point": {
          "xAxis": 0,
          "yAxis": 0,
          "x": 16,
          "y": 4100
        },
        "text": "Competitor promotion"
      },
      {
        "point": {
          "xAxis": 0,
          "yAxis": 0,
          "x": 24,
          "y": 5700
        },
        "x": 20,
        "text": "Post Holiday Season"
      },
      {
        "point": {
          "xAxis": 0,
          "yAxis": 0,
          "x": 73,
          "y": 4900
        },
        "text": "Lockdown"
      }
    ]
  },
  {
    "draggable": "",
    "labels": [
      {
        "point": {
          "xAxis": 0,
          "yAxis": 0,
          "x": 26,
          "y": 10300
        },
        "text": "World Cup"
      },
      {
        "point": {
          "xAxis": 0,
          "yAxis": 0,
          "x": 53.5,
          "y": 4300
        },
        "text": "Black Friday"
      },
      {
        "point": {
          "xAxis": 0,
          "yAxis": 0,
          "x": 87,
          "y": 3800
        },
        "text": "Back to School <br>Strong Assortment"
      }
    ]
  },
  {
    "draggable": "",
    "labelOptions": {
      "shape": "connector",
      "align": "right",
      "justify": false,
      "crop": true,
      "style": {
        "fontSize": "0.8em",
        "textOutline": "1px white"
      }
    },
    "labels": [
      {
        "point": {
          "xAxis": 0,
          "yAxis": 0,
          "x": 22,
          "y": 6800
        },
        "text": "Competitive discount on <br> selected models"
      },
      {
        "point": {
          "xAxis": 0,
          "yAxis": 0,
          "x": 74.5,
          "y": 7500
        },
        "text": "Another strong growth <br>led by strategic markets"
      }
    ]
  }
],
Ulas